| Red | Green | Blue | |
| z | 17.64 | ||
| znorm | Inf | ||
| sky | -NaN | -Inf | -Inf |
| S/N | 26.5 | 44.9 | 47.5 |
| S/N(c) | 0.0 | 0.0 | 0.0 |
| SN(E/C) |
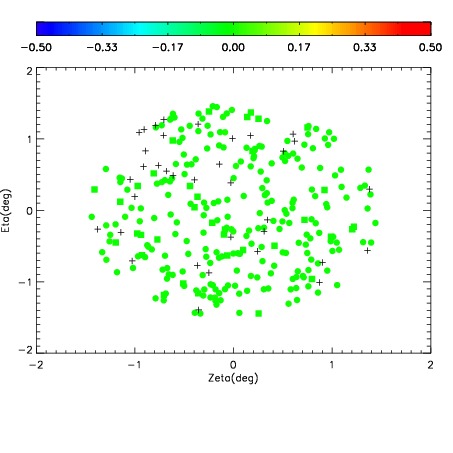
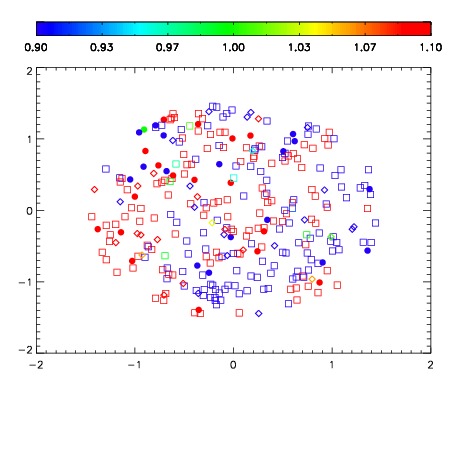


| Frame | Nreads | Zeropoints | Mag plots | Spatial mag deviation | Spatial sky 16325A emission deviations (filled: sky, open: star) | Spatial sky continuum emission | Spatial sky telluric CO2 absorption deviations (filled: H < 10) | |||||||||||||||||||||||
| 0 | 0 |
|
|
|
|
|
|
| IPAIR | NAME | SHIFT | NEWSHIFT | S/N | NAME | SHIFT | NEWSHIFT | S/N |
| 0 | 07530056 | 0.477538 | 0.00000 | 18.9949 | 07530054 | 0.000508679 | 0.477029 | 18.9986 |
| 1 | 07530051 | 0.475364 | 0.00217399 | 19.0763 | 07530050 | 0.00000 | 0.477538 | 19.0625 |
| 2 | 07530052 | 0.476183 | 0.00135499 | 19.0645 | 07530053 | 0.00292355 | 0.474614 | 19.0393 |
| 3 | 07530055 | 0.476915 | 0.000622988 | 18.9693 | 07530057 | 0.00311976 | 0.474418 | 18.9742 |