| Red | Green | Blue | |
| z | 17.64 | ||
| znorm | Inf | ||
| sky | -NaN | -Inf | -Inf |
| S/N | 19.9 | 36.8 | 38.8 |
| S/N(c) | 0.0 | 0.0 | 0.0 |
| SN(E/C) |
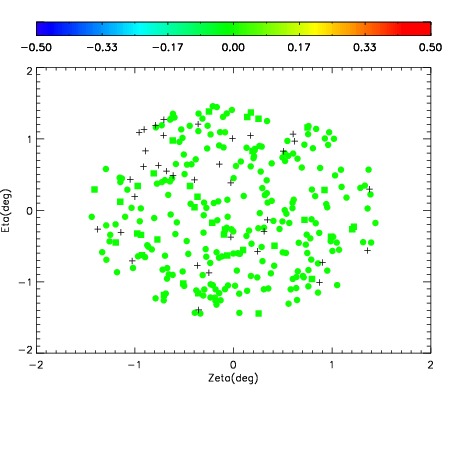
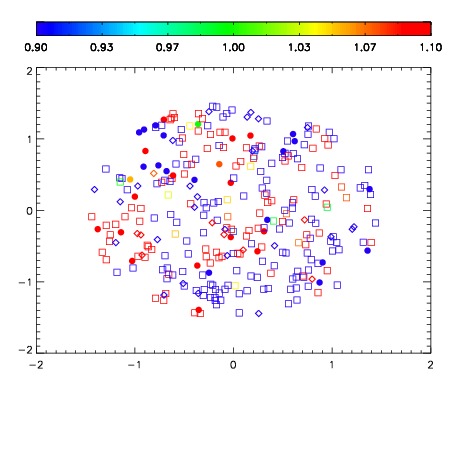


| Frame | Nreads | Zeropoints | Mag plots | Spatial mag deviation | Spatial sky 16325A emission deviations (filled: sky, open: star) | Spatial sky continuum emission | Spatial sky telluric CO2 absorption deviations (filled: H < 10) | |||||||||||||||||||||||
| 0 | 0 |
|
|
|
|
|
|
| IPAIR | NAME | SHIFT | NEWSHIFT | S/N | NAME | SHIFT | NEWSHIFT | S/N |
| 0 | 07610032 | 0.484544 | 0.00000 | 18.4094 | 07610033 | -0.000538892 | 0.485083 | 18.3225 |
| 1 | 07610028 | 0.483775 | 0.000769019 | 18.7051 | 07610030 | 0.00156604 | 0.482978 | 18.6716 |
| 2 | 07610027 | 0.482245 | 0.00229901 | 18.6951 | 07610029 | 0.00202615 | 0.482518 | 18.6573 |
| 3 | 07610031 | 0.484481 | 6.30021e-05 | 18.6715 | 07610026 | 0.00000 | 0.484544 | 18.6140 |