| Red | Green | Blue | |
| z | 17.64 | ||
| znorm | Inf | ||
| sky | -NaN | -NaN | -Inf |
| S/N | 27.9 | 47.6 | 50.6 |
| S/N(c) | 0.0 | 0.0 | 0.0 |
| SN(E/C) |


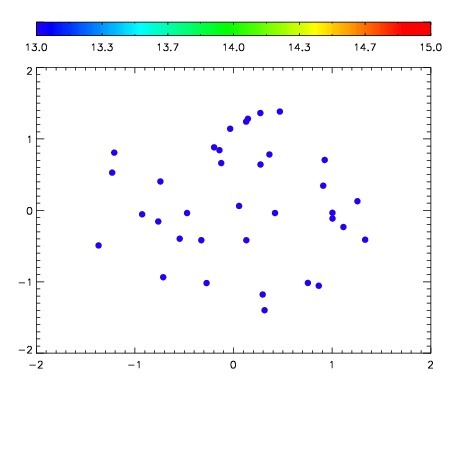

| Frame | Nreads | Zeropoints | Mag plots | Spatial mag deviation | Spatial sky 16325A emission deviations (filled: sky, open: star) | Spatial sky continuum emission | Spatial sky telluric CO2 absorption deviations (filled: H < 10) | |||||||||||||||||||||||
| 0 | 0 |
|
|
|
|
|
|
| IPAIR | NAME | SHIFT | NEWSHIFT | S/N | NAME | SHIFT | NEWSHIFT | S/N |
| 0 | 06650072 | 0.483381 | 0.00000 | 19.1322 | 06650070 | 0.00000 | 0.483381 | 19.1255 |
| 1 | 06650076 | 0.481188 | 0.00219300 | 19.1496 | 06650073 | 0.00121059 | 0.482170 | 19.1311 |
| 2 | 06650071 | 0.482620 | 0.000761002 | 19.1188 | 06650074 | 0.000206274 | 0.483175 | 19.1018 |
| 3 | 06650075 | 0.481589 | 0.00179201 | 19.0771 | 06650077 | 0.00282028 | 0.480561 | 19.0742 |