| Red | Green | Blue | |
| z | 17.64 | ||
| znorm | Inf | ||
| sky | -Inf | -Inf | -Inf |
| S/N | 28.0 | 48.2 | 52.2 |
| S/N(c) | 0.0 | 0.0 | 0.0 |
| SN(E/C) |
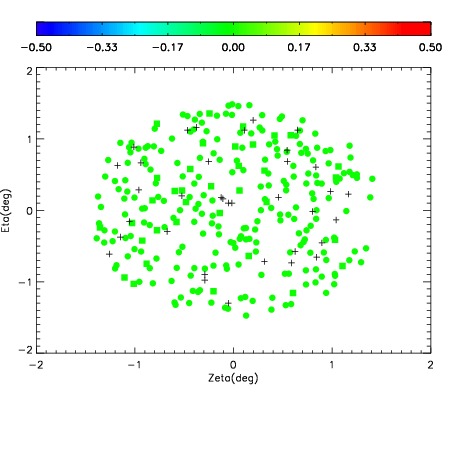
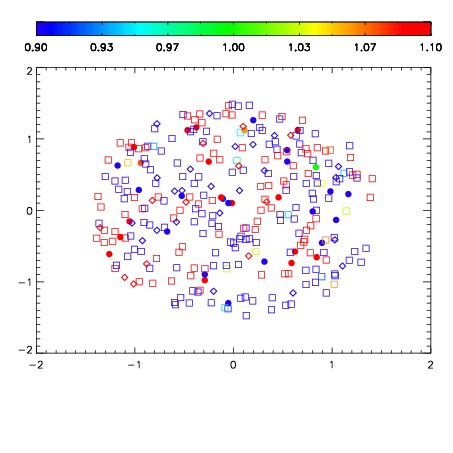
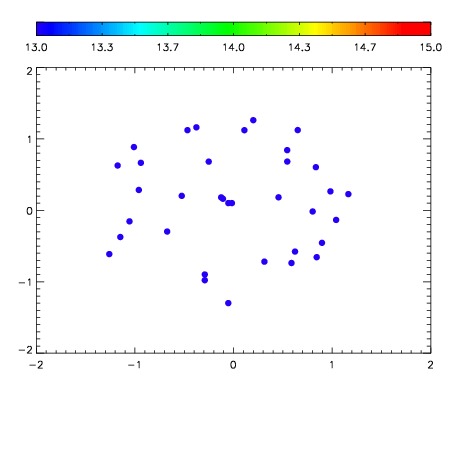

| Frame | Nreads | Zeropoints | Mag plots | Spatial mag deviation | Spatial sky 16325A emission deviations (filled: sky, open: star) | Spatial sky continuum emission | Spatial sky telluric CO2 absorption deviations (filled: H < 10) | |||||||||||||||||||||||
| 0 | 0 |
|
|
|
|
|
|
| IPAIR | NAME | SHIFT | NEWSHIFT | S/N | NAME | SHIFT | NEWSHIFT | S/N |
| 0 | 06410081 | 0.475476 | 0.00000 | 19.1322 | 06410083 | -0.00105759 | 0.476534 | 19.1689 |
| 1 | 06410085 | 0.473790 | 0.00168601 | 19.1407 | 06410086 | 0.00204009 | 0.473436 | 19.1915 |
| 2 | 06410080 | 0.475199 | 0.000276983 | 19.1272 | 06410082 | 0.00152812 | 0.473948 | 19.1269 |
| 3 | 06410084 | 0.473518 | 0.00195798 | 19.1135 | 06410079 | 0.00000 | 0.475476 | 19.1069 |