| Red | Green | Blue | |
| z | 17.64 | ||
| znorm | Inf | ||
| sky | -NaN | -Inf | -Inf |
| S/N | 27.2 | 47.6 | 50.3 |
| S/N(c) | 0.0 | 0.0 | 0.0 |
| SN(E/C) |
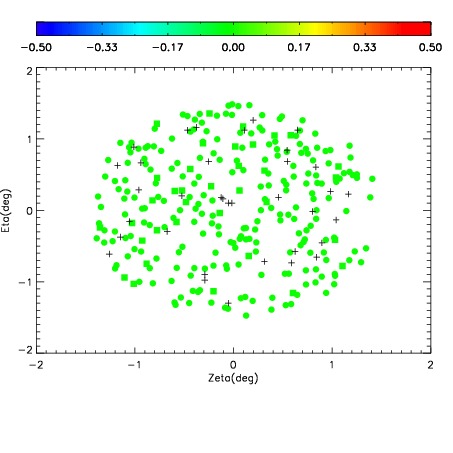
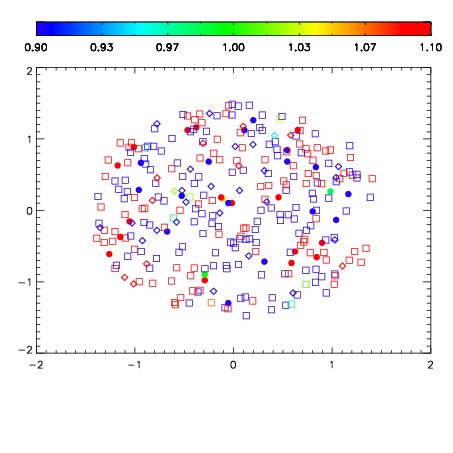
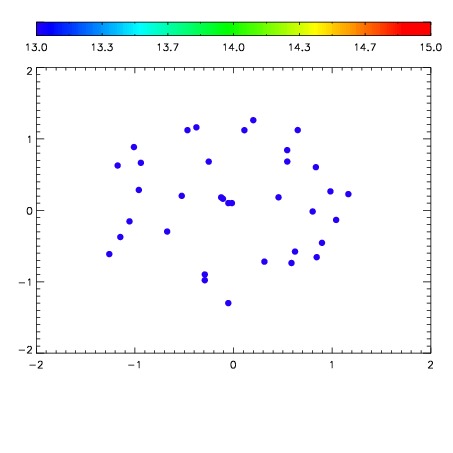

| Frame | Nreads | Zeropoints | Mag plots | Spatial mag deviation | Spatial sky 16325A emission deviations (filled: sky, open: star) | Spatial sky continuum emission | Spatial sky telluric CO2 absorption deviations (filled: H < 10) | |||||||||||||||||||||||
| 0 | 0 |
|
|
|
|
|
|
| IPAIR | NAME | SHIFT | NEWSHIFT | S/N | NAME | SHIFT | NEWSHIFT | S/N |
| 0 | 06640071 | 0.482974 | 0.00000 | 19.1109 | 06640072 | -0.000844777 | 0.483819 | 19.1251 |
| 1 | 06640070 | 0.482684 | 0.000290006 | 19.0984 | 06640073 | -0.00156502 | 0.484539 | 19.1208 |
| 2 | 06640074 | 0.482082 | 0.000891984 | 19.0946 | 06640069 | 0.00000 | 0.482974 | 19.1005 |
| 3 | 06640075 | 0.482379 | 0.000595003 | 19.0874 | 06640076 | 0.00122868 | 0.481745 | 19.0951 |