| Red | Green | Blue | |
| z | 17.64 | ||
| znorm | Inf | ||
| sky | -Inf | -NaN | -Inf |
| S/N | 27.3 | 47.8 | 49.7 |
| S/N(c) | 0.0 | 0.0 | 0.0 |
| SN(E/C) |
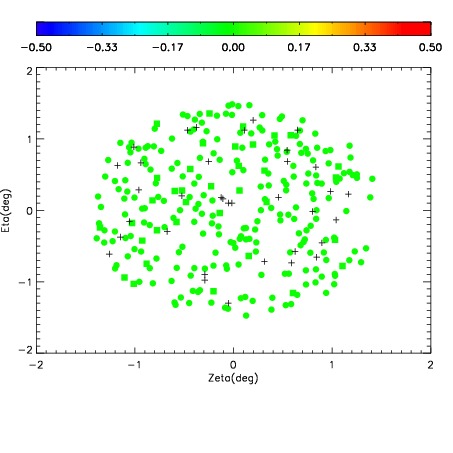
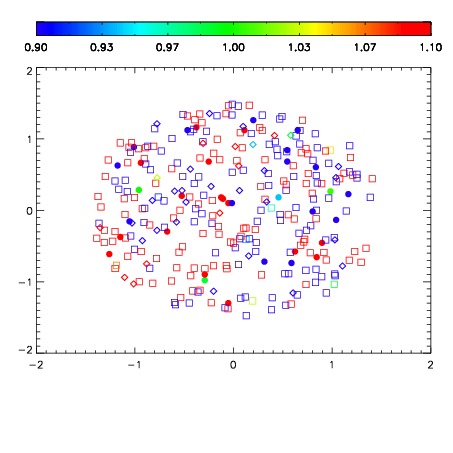


| Frame | Nreads | Zeropoints | Mag plots | Spatial mag deviation | Spatial sky 16325A emission deviations (filled: sky, open: star) | Spatial sky continuum emission | Spatial sky telluric CO2 absorption deviations (filled: H < 10) | |||||||||||||||||||||||
| 0 | 0 |
|
|
|
|
|
|
| IPAIR | NAME | SHIFT | NEWSHIFT | S/N | NAME | SHIFT | NEWSHIFT | S/N |
| 0 | 06680066 | 0.483663 | 0.00000 | 18.9935 | 06680069 | 0.000599368 | 0.483064 | 19.0332 |
| 1 | 06680070 | 0.482900 | 0.000762999 | 19.0359 | 06680072 | -0.000125735 | 0.483789 | 19.0653 |
| 2 | 06680071 | 0.483202 | 0.000460982 | 18.9817 | 06680065 | 0.00000 | 0.483663 | 18.9774 |
| 3 | 06680067 | 0.483608 | 5.49853e-05 | 18.9427 | 06680068 | 0.00247733 | 0.481186 | 18.9550 |