| Red | Green | Blue | |
| z | 17.64 | ||
| znorm | Inf | ||
| sky | -Inf | -Inf | -Inf |
| S/N | 28.4 | 48.8 | 51.6 |
| S/N(c) | 0.0 | 0.0 | 0.0 |
| SN(E/C) |


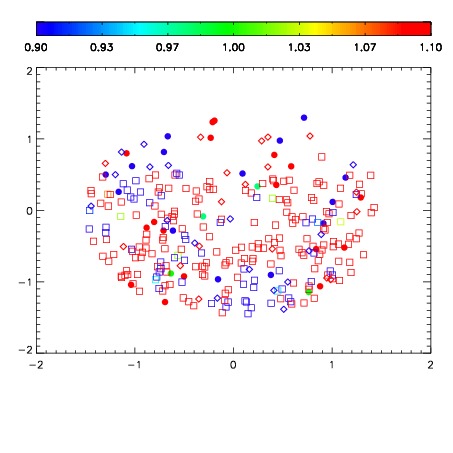


| Frame | Nreads | Zeropoints | Mag plots | Spatial mag deviation | Spatial sky 16325A emission deviations (filled: sky, open: star) | Spatial sky continuum emission | Spatial sky telluric CO2 absorption deviations (filled: H < 10) | |||||||||||||||||||||||
| 0 | 0 |
|
|
|
|
|
|
| IPAIR | NAME | SHIFT | NEWSHIFT | S/N | NAME | SHIFT | NEWSHIFT | S/N |
| 0 | 06960063 | 0.490260 | 0.00000 | 19.1100 | 06960064 | 0.000387242 | 0.489873 | 19.0969 |
| 1 | 06960059 | 0.488391 | 0.00186899 | 19.1242 | 06960061 | 0.00182250 | 0.488438 | 19.1174 |
| 2 | 06960062 | 0.489111 | 0.00114900 | 19.1200 | 06960060 | 0.000850461 | 0.489410 | 19.1154 |
| 3 | 06960058 | 0.488000 | 0.00226000 | 19.1066 | 06960057 | 0.00000 | 0.490260 | 19.0690 |