| Red | Green | Blue | |
| z | 17.64 | ||
| znorm | Inf | ||
| sky | -Inf | -Inf | -Inf |
| S/N | 24.7 | 42.1 | 44.1 |
| S/N(c) | 0.0 | 0.0 | 0.0 |
| SN(E/C) |
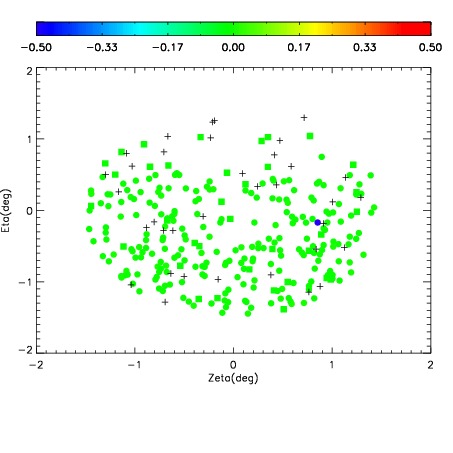
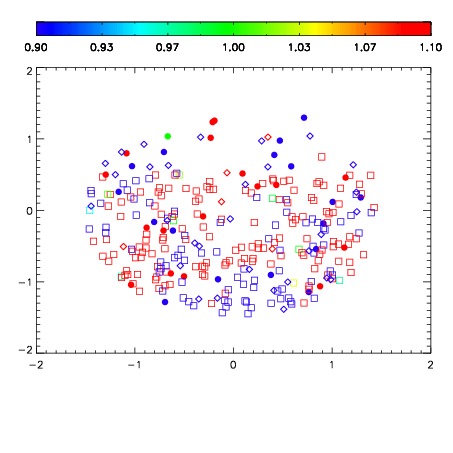


| Frame | Nreads | Zeropoints | Mag plots | Spatial mag deviation | Spatial sky 16325A emission deviations (filled: sky, open: star) | Spatial sky continuum emission | Spatial sky telluric CO2 absorption deviations (filled: H < 10) | |||||||||||||||||||||||
| 0 | 0 |
|
|
|
|
|
|
| IPAIR | NAME | SHIFT | NEWSHIFT | S/N | NAME | SHIFT | NEWSHIFT | S/N |
| 0 | 07030066 | 0.474862 | 0.00000 | 18.9178 | 07030067 | 0.00206222 | 0.472800 | 18.8913 |
| 1 | 07030062 | 0.472817 | 0.00204501 | 19.0753 | 07030064 | 0.00286767 | 0.471994 | 19.0454 |
| 2 | 07030061 | 0.473005 | 0.00185701 | 19.0595 | 07030063 | 0.000874887 | 0.473987 | 18.9984 |
| 3 | 07030065 | 0.473692 | 0.00117001 | 19.0035 | 07030060 | 0.00000 | 0.474862 | 18.9735 |