| Red | Green | Blue | |
| z | 17.64 | ||
| znorm | Inf | ||
| sky | -Inf | -Inf | -Inf |
| S/N | 33.1 | 55.5 | 61.1 |
| S/N(c) | 0.0 | 0.0 | 0.0 |
| SN(E/C) |
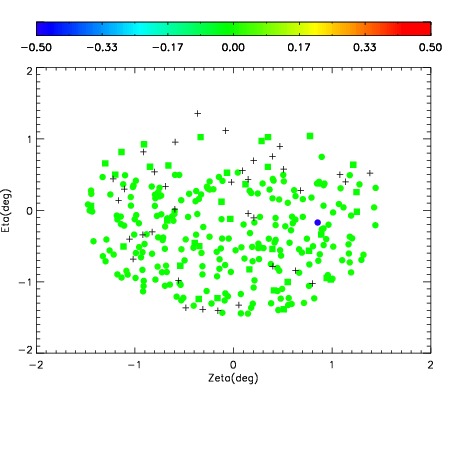


| Frame | Nreads | Zeropoints | Mag plots | Spatial mag deviation | Spatial sky 16325A emission deviations (filled: sky, open: star) | Spatial sky continuum emission | Spatial sky telluric CO2 absorption deviations (filled: H < 10) | |||||||||||||||||||||||
| 0 | 0 |
|
|
|
|
|
|
| IPAIR | NAME | SHIFT | NEWSHIFT | S/N | NAME | SHIFT | NEWSHIFT | S/N |
| 0 | 06970085 | 0.491127 | 0.00000 | 19.1968 | 06970090 | 0.000361320 | 0.490766 | 19.1777 |
| 1 | 06970084 | 0.489378 | 0.00174901 | 19.1990 | 06970083 | 0.00000 | 0.491127 | 19.1886 |
| 2 | 06970089 | 0.490624 | 0.000503004 | 19.1793 | 06970091 | -0.000810625 | 0.491938 | 19.1681 |
| 3 | 06970088 | 0.489761 | 0.00136602 | 19.1713 | 06970086 | 0.000440207 | 0.490687 | 19.1609 |
| 4 | 06970092 | 0.487238 | 0.00388902 | 19.1421 | 06970087 | -2.13195e-05 | 0.491148 | 19.1571 |