| Red | Green | Blue | |
| z | 17.64 | ||
| znorm | Inf | ||
| sky | -Inf | -Inf | -Inf |
| S/N | 17.9 | 33.2 | 34.8 |
| S/N(c) | 0.0 | 0.0 | 0.0 |
| SN(E/C) |
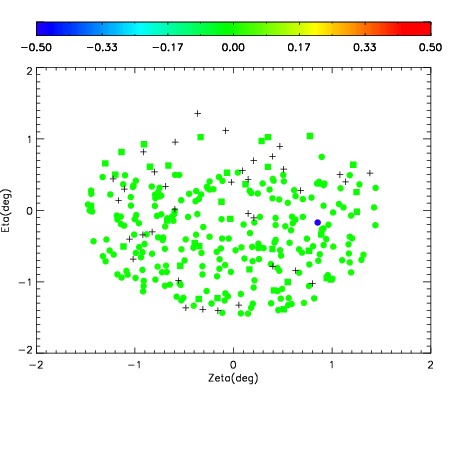
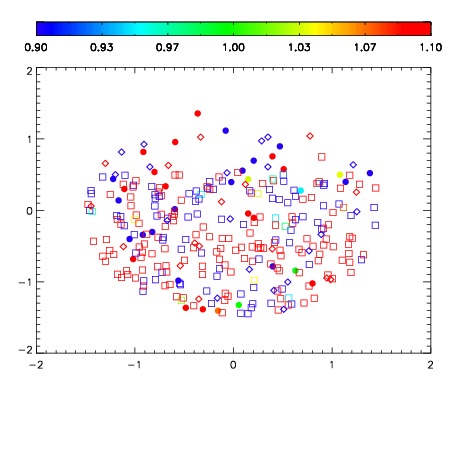


| Frame | Nreads | Zeropoints | Mag plots | Spatial mag deviation | Spatial sky 16325A emission deviations (filled: sky, open: star) | Spatial sky continuum emission | Spatial sky telluric CO2 absorption deviations (filled: H < 10) | |||||||||||||||||||||||
| 0 | 0 |
|
|
|
|
|
|
| IPAIR | NAME | SHIFT | NEWSHIFT | S/N | NAME | SHIFT | NEWSHIFT | S/N |
| 0 | 07040053 | 0.473120 | 0.00000 | 18.4106 | 07040052 | 0.00231906 | 0.470801 | 18.5398 |
| 1 | 07040050 | 0.472472 | 0.000647992 | 18.6412 | 07040048 | 0.00000 | 0.473120 | 18.8121 |
| 2 | 07040049 | 0.471278 | 0.00184199 | 18.5202 | 07040051 | 0.00283829 | 0.470282 | 18.7220 |
| 3 | 07040054 | 0.473020 | 0.000100017 | 18.2123 | 07040055 | 0.00621988 | 0.466900 | 18.2601 |