| Red | Green | Blue | |
| z | 17.64 | ||
| znorm | Inf | ||
| sky | -Inf | -Inf | -Inf |
| S/N | 22.9 | 41.2 | 44.2 |
| S/N(c) | 0.0 | 0.0 | 0.0 |
| SN(E/C) |
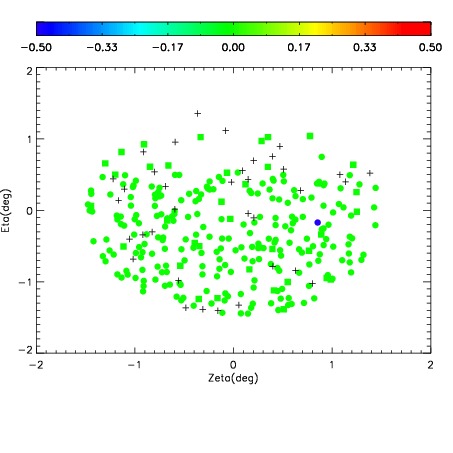
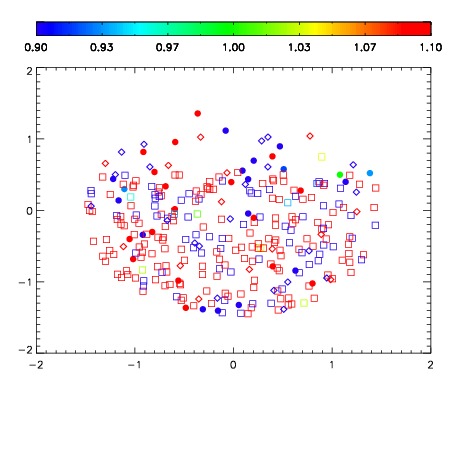


| Frame | Nreads | Zeropoints | Mag plots | Spatial mag deviation | Spatial sky 16325A emission deviations (filled: sky, open: star) | Spatial sky continuum emission | Spatial sky telluric CO2 absorption deviations (filled: H < 10) | |||||||||||||||||||||||
| 0 | 0 |
|
|
|
|
|
|
| IPAIR | NAME | SHIFT | NEWSHIFT | S/N | NAME | SHIFT | NEWSHIFT | S/N |
| 0 | 07510064 | 0.470961 | 0.00000 | 18.9085 | 07510069 | -0.00567052 | 0.476632 | 18.8239 |
| 1 | 07510063 | 0.469602 | 0.00135902 | 19.0184 | 07510062 | 0.00000 | 0.470961 | 18.9631 |
| 2 | 07510068 | 0.469919 | 0.00104201 | 18.7942 | 07510065 | -0.000863548 | 0.471825 | 18.7961 |
| 3 | 07510067 | 0.469386 | 0.00157499 | 18.6527 | 07510066 | -0.00490992 | 0.475871 | 18.7506 |