| Red | Green | Blue | |
| z | 17.64 | ||
| znorm | Inf | ||
| sky | -Inf | -Inf | -Inf |
| S/N | 25.8 | 42.2 | 44.6 |
| S/N(c) | 0.0 | 0.0 | 0.0 |
| SN(E/C) |


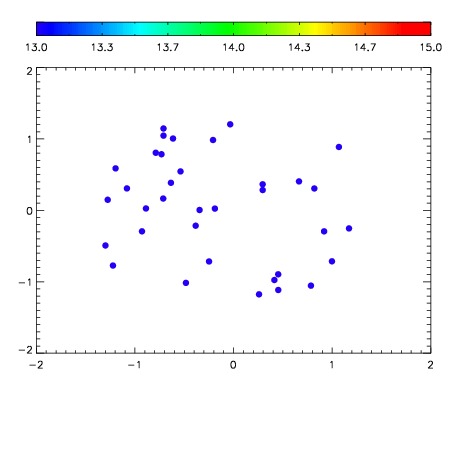

| Frame | Nreads | Zeropoints | Mag plots | Spatial mag deviation | Spatial sky 16325A emission deviations (filled: sky, open: star) | Spatial sky continuum emission | Spatial sky telluric CO2 absorption deviations (filled: H < 10) | |||||||||||||||||||||||
| 0 | 0 |
|
|
|
|
|
|
| IPAIR | NAME | SHIFT | NEWSHIFT | S/N | NAME | SHIFT | NEWSHIFT | S/N |
| 0 | 06460028 | 0.471215 | 0.00000 | 19.1501 | 06460029 | 0.000990504 | 0.470224 | 19.2220 |
| 1 | 06460027 | 0.470585 | 0.000630021 | 18.9681 | 06460025 | 0.00189205 | 0.469323 | 19.0283 |
| 2 | 06460023 | 0.470170 | 0.00104502 | 18.8710 | 06460026 | 0.000720573 | 0.470494 | 18.9447 |
| 3 | 06460024 | 0.470659 | 0.000556022 | 18.8534 | 06460022 | 0.00000 | 0.471215 | 18.7494 |