| Red | Green | Blue | |
| z | 17.64 | ||
| znorm | Inf | ||
| sky | -Inf | -NaN | -Inf |
| S/N | 29.7 | 47.4 | 54.5 |
| S/N(c) | 0.0 | 0.0 | 0.0 |
| SN(E/C) |
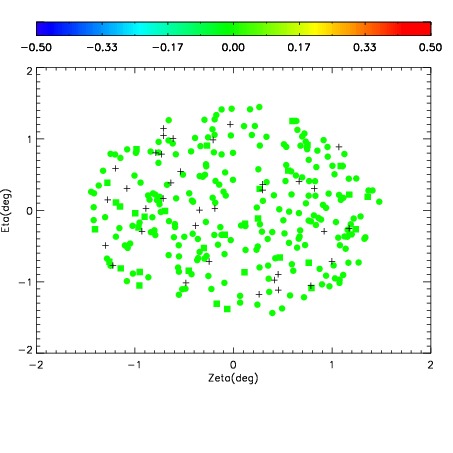
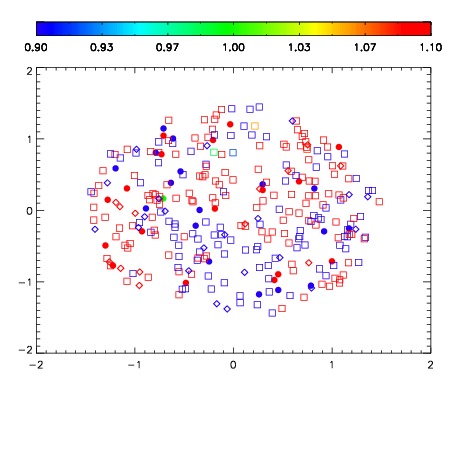


| Frame | Nreads | Zeropoints | Mag plots | Spatial mag deviation | Spatial sky 16325A emission deviations (filled: sky, open: star) | Spatial sky continuum emission | Spatial sky telluric CO2 absorption deviations (filled: H < 10) | |||||||||||||||||||||||
| 0 | 0 |
|
|
|
|
|
|
| IPAIR | NAME | SHIFT | NEWSHIFT | S/N | NAME | SHIFT | NEWSHIFT | S/N |
| 0 | 06660083 | 0.483619 | 0.00000 | 19.1410 | 06660078 | 0.00000 | 0.483619 | 19.1263 |
| 1 | 06660080 | 0.482903 | 0.000716001 | 19.1737 | 06660081 | 0.00595495 | 0.477664 | 19.1706 |
| 2 | 06660084 | 0.483062 | 0.000557005 | 19.1567 | 06660082 | 0.00155465 | 0.482064 | 19.1400 |
| 3 | 06660079 | 0.483026 | 0.000593007 | 19.1482 | 06660085 | 0.00364200 | 0.479977 | 19.1351 |