| Red | Green | Blue | |
| z | 17.64 | ||
| znorm | Inf | ||
| sky | -Inf | -Inf | -Inf |
| S/N | 26.8 | 44.7 | 48.2 |
| S/N(c) | 0.0 | 0.0 | 0.0 |
| SN(E/C) |
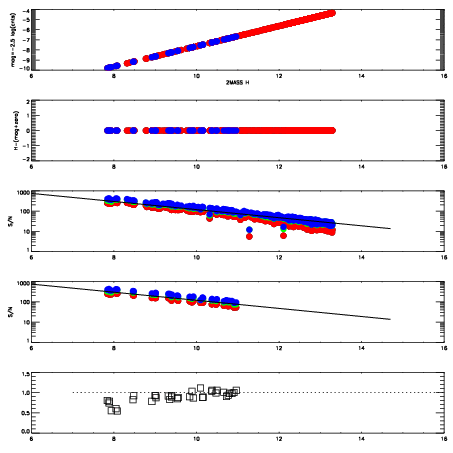
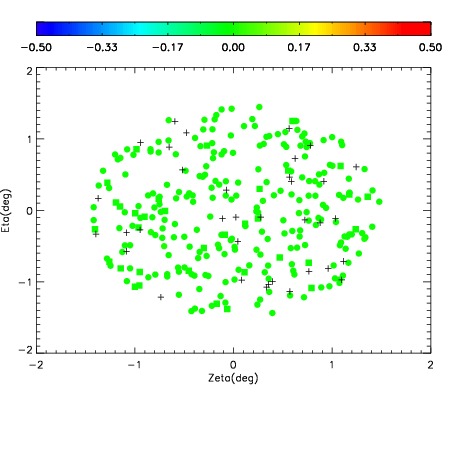
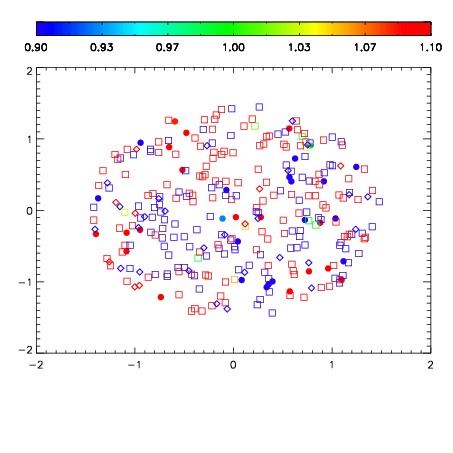
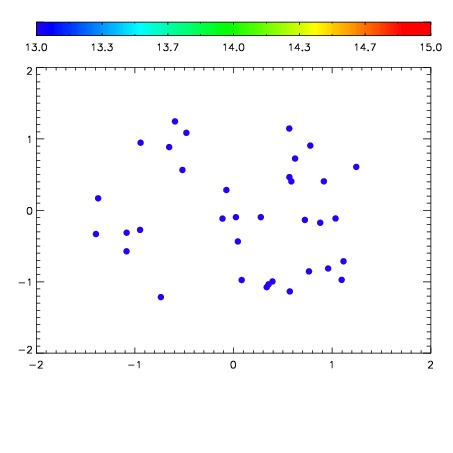

| Frame | Nreads | Zeropoints | Mag plots | Spatial mag deviation | Spatial sky 16325A emission deviations (filled: sky, open: star) | Spatial sky continuum emission | Spatial sky telluric CO2 absorption deviations (filled: H < 10) | |||||||||||||||||||||||
| 0 | 0 |
|
|
|
|
|
|
| IPAIR | NAME | SHIFT | NEWSHIFT | S/N | NAME | SHIFT | NEWSHIFT | S/N |
| 0 | 06410096 | 0.472371 | 0.00000 | 19.0902 | 06410097 | -0.00388720 | 0.476258 | 19.0619 |
| 1 | 06410091 | 0.470490 | 0.00188100 | 19.1220 | 06410090 | 0.00000 | 0.472371 | 19.1260 |
| 2 | 06410092 | 0.470808 | 0.00156301 | 19.0842 | 06410093 | 0.00212852 | 0.470243 | 19.0235 |
| 3 | 06410095 | 0.471970 | 0.000401020 | 19.0291 | 06410094 | 0.00294641 | 0.469425 | 18.9048 |