| Red | Green | Blue | |
| z | 17.64 | ||
| znorm | Inf | ||
| sky | -Inf | -Inf | -Inf |
| S/N | 27.3 | 43.5 | 50.1 |
| S/N(c) | 0.0 | 0.0 | 0.0 |
| SN(E/C) |
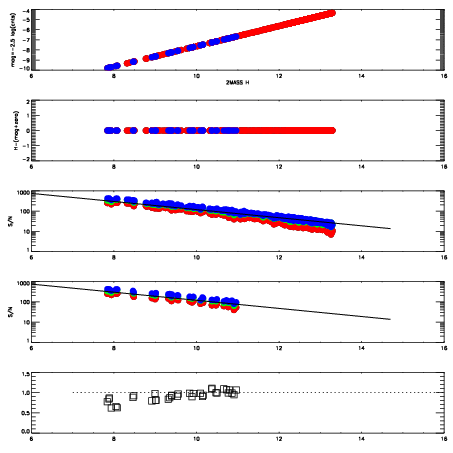
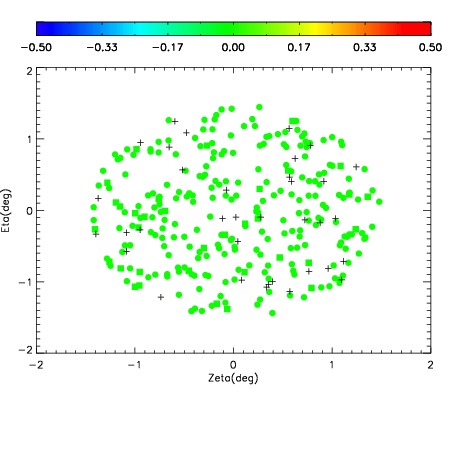
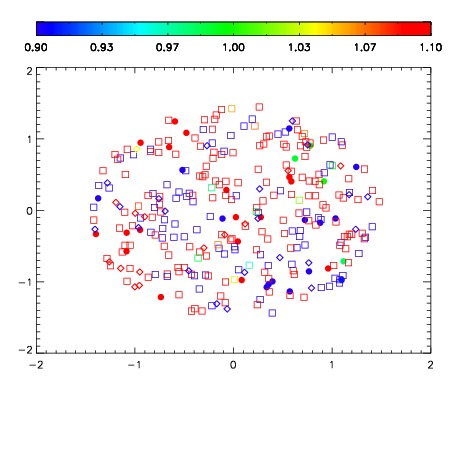


| Frame | Nreads | Zeropoints | Mag plots | Spatial mag deviation | Spatial sky 16325A emission deviations (filled: sky, open: star) | Spatial sky continuum emission | Spatial sky telluric CO2 absorption deviations (filled: H < 10) | |||||||||||||||||||||||
| 0 | 0 |
|
|
|
|
|
|
| IPAIR | NAME | SHIFT | NEWSHIFT | S/N | NAME | SHIFT | NEWSHIFT | S/N |
| 0 | 06640086 | 0.485470 | 0.00000 | 19.0543 | 06640084 | -0.000270306 | 0.485740 | 19.0633 |
| 1 | 06640085 | 0.485194 | 0.000275999 | 19.0732 | 06640087 | 0.00117094 | 0.484299 | 19.0665 |
| 2 | 06640081 | 0.484204 | 0.00126600 | 18.9911 | 06640080 | 0.00000 | 0.485470 | 19.0370 |
| 3 | 06640082 | 0.484640 | 0.000829995 | 18.9737 | 06640083 | 0.00278980 | 0.482680 | 19.0047 |