| Red | Green | Blue | |
| z | 17.64 | ||
| znorm | Inf | ||
| sky | -NaN | -Inf | -Inf |
| S/N | 27.1 | 43.8 | 50.8 |
| S/N(c) | 0.0 | 0.0 | 0.0 |
| SN(E/C) |

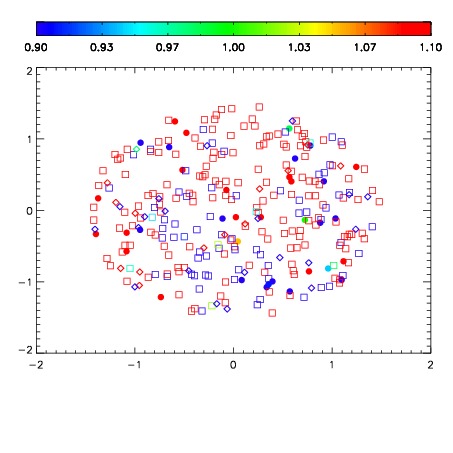


| Frame | Nreads | Zeropoints | Mag plots | Spatial mag deviation | Spatial sky 16325A emission deviations (filled: sky, open: star) | Spatial sky continuum emission | Spatial sky telluric CO2 absorption deviations (filled: H < 10) | |||||||||||||||||||||||
| 0 | 0 |
|
|
|
|
|
|
| IPAIR | NAME | SHIFT | NEWSHIFT | S/N | NAME | SHIFT | NEWSHIFT | S/N |
| 0 | 06680082 | 0.485918 | 0.00000 | 19.0423 | 06680079 | 0.000635356 | 0.485283 | 19.0392 |
| 1 | 06680081 | 0.485455 | 0.000462979 | 19.1050 | 06680083 | 0.00165344 | 0.484265 | 19.0911 |
| 2 | 06680077 | 0.485776 | 0.000141978 | 19.1030 | 06680080 | -0.00134107 | 0.487259 | 19.0771 |
| 3 | 06680078 | 0.485890 | 2.79844e-05 | 19.0553 | 06680076 | 0.00000 | 0.485918 | 19.0666 |