| Red | Green | Blue | |
| z | 17.64 | ||
| znorm | Inf | ||
| sky | -NaN | -NaN | -Inf |
| S/N | 34.4 | 59.6 | 64.5 |
| S/N(c) | 0.0 | 0.0 | 0.0 |
| SN(E/C) |
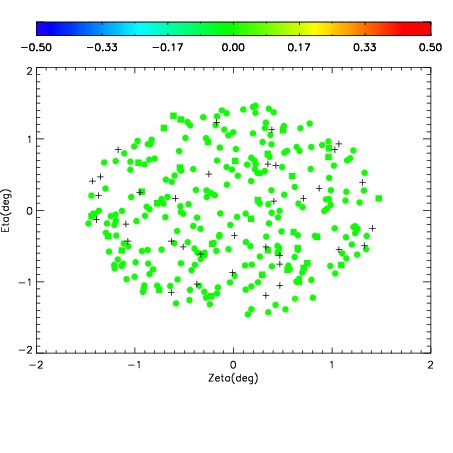
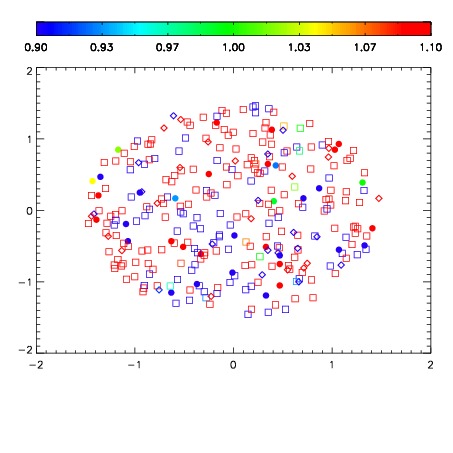
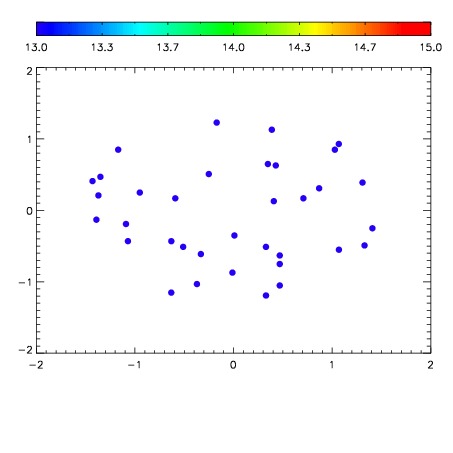

| Frame | Nreads | Zeropoints | Mag plots | Spatial mag deviation | Spatial sky 16325A emission deviations (filled: sky, open: star) | Spatial sky continuum emission | Spatial sky telluric CO2 absorption deviations (filled: H < 10) | |||||||||||||||||||||||
| 0 | 0 |
|
|
|
|
|
|
| IPAIR | NAME | SHIFT | NEWSHIFT | S/N | NAME | SHIFT | NEWSHIFT | S/N |
| 0 | 07500074 | 0.484114 | 0.00000 | 19.0608 | 07500068 | -0.000277512 | 0.484392 | 19.0332 |
| 1 | 07500070 | 0.480122 | 0.00399199 | 19.0907 | 07500071 | 0.00286676 | 0.481247 | 19.0681 |
| 2 | 07500069 | 0.477194 | 0.00691998 | 19.0878 | 07500072 | 0.00445259 | 0.479661 | 19.0676 |
| 3 | 07500073 | 0.483032 | 0.00108200 | 19.0647 | 07500075 | 0.00467932 | 0.479435 | 19.0591 |
| 4 | 07500066 | 0.478603 | 0.00551099 | 19.0565 | 07500067 | 0.000903197 | 0.483211 | 19.0279 |
| 5 | 07500065 | 0.478692 | 0.00542200 | 18.9994 | 07500064 | 0.00000 | 0.484114 | 18.8049 |