| Red | Green | Blue | |
| z | 17.64 | ||
| znorm | Inf | ||
| sky | -Inf | -NaN | -Inf |
| S/N | 19.9 | 33.6 | 37.8 |
| S/N(c) | 0.0 | 0.0 | 0.0 |
| SN(E/C) |
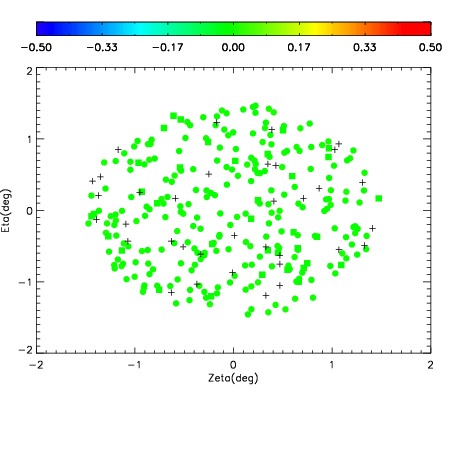
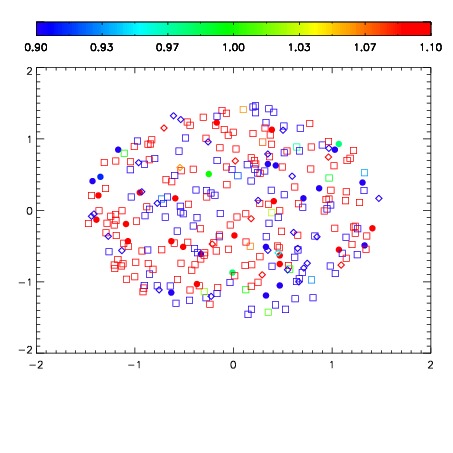
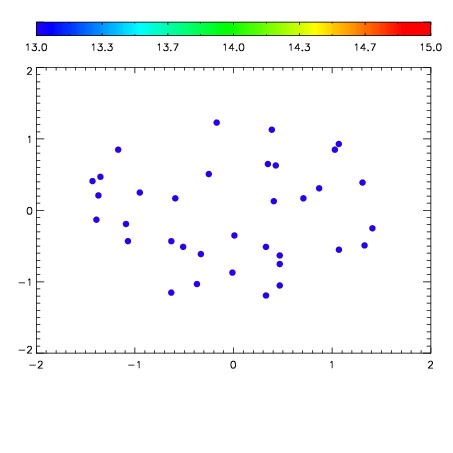

| Frame | Nreads | Zeropoints | Mag plots | Spatial mag deviation | Spatial sky 16325A emission deviations (filled: sky, open: star) | Spatial sky continuum emission | Spatial sky telluric CO2 absorption deviations (filled: H < 10) | |||||||||||||||||||||||
| 0 | 0 |
|
|
|
|
|
|
| IPAIR | NAME | SHIFT | NEWSHIFT | S/N | NAME | SHIFT | NEWSHIFT | S/N |
| 0 | 07540054 | 0.478037 | 0.00000 | 19.1986 | 07540055 | 0.00357513 | 0.474462 | 19.1695 |
| 1 | 07540053 | 0.476925 | 0.00111201 | 19.1665 | 07540051 | 0.00250053 | 0.475536 | 18.6510 |
| 2 | 07540050 | 0.477234 | 0.000802994 | 16.8143 | 07540052 | 0.000650582 | 0.477386 | 18.5599 |