| Red | Green | Blue | |
| z | 17.64 | ||
| znorm | Inf | ||
| sky | -NaN | -NaN | -Inf |
| S/N | 33.1 | 55.7 | 62.6 |
| S/N(c) | 0.0 | 0.0 | 0.0 |
| SN(E/C) |
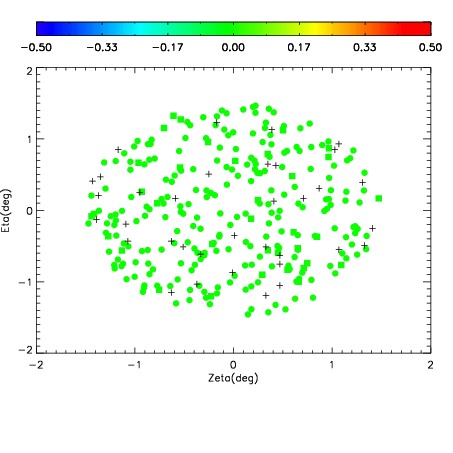
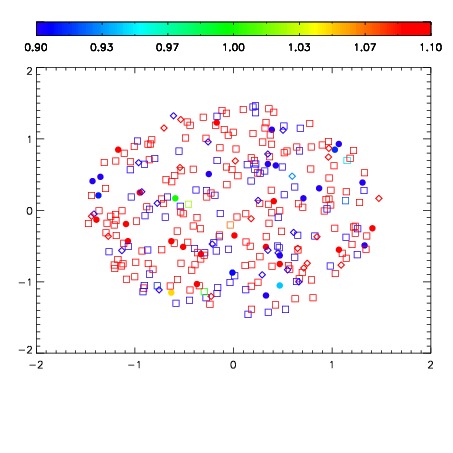
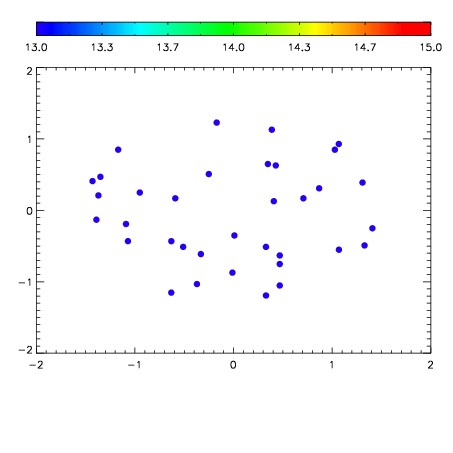

| Frame | Nreads | Zeropoints | Mag plots | Spatial mag deviation | Spatial sky 16325A emission deviations (filled: sky, open: star) | Spatial sky continuum emission | Spatial sky telluric CO2 absorption deviations (filled: H < 10) | |||||||||||||||||||||||
| 0 | 0 |
|
|
|
|
|
|
| IPAIR | NAME | SHIFT | NEWSHIFT | S/N | NAME | SHIFT | NEWSHIFT | S/N |
| 0 | 07870035 | 0.469330 | 0.00000 | 18.7445 | 07870033 | 0.000329649 | 0.469000 | 18.7154 |
| 1 | 07870031 | 0.468985 | 0.000345021 | 19.0646 | 07870032 | 0.000302520 | 0.469027 | 19.0608 |
| 2 | 07870030 | 0.468738 | 0.000592023 | 19.0455 | 07870025 | 0.00000 | 0.469330 | 19.0222 |
| 3 | 07870026 | 0.468593 | 0.000737011 | 19.0337 | 07870029 | -2.60397e-05 | 0.469356 | 19.0215 |
| 4 | 07870027 | 0.468927 | 0.000403017 | 19.0193 | 07870028 | 0.000817733 | 0.468512 | 18.9795 |
| 5 | 07870038 | 0.467083 | 0.00224701 | 18.8477 | 07870037 | 0.00207896 | 0.467251 | 18.8560 |
| 6 | 07870034 | 0.469061 | 0.000269026 | 18.6995 | 07870036 | 0.00106859 | 0.468261 | 18.6622 |