| Red | Green | Blue | |
| z | 17.64 | ||
| znorm | Inf | ||
| sky | -NaN | -Inf | -Inf |
| S/N | 29.5 | 48.2 | 54.2 |
| S/N(c) | 0.0 | 0.0 | 0.0 |
| SN(E/C) |

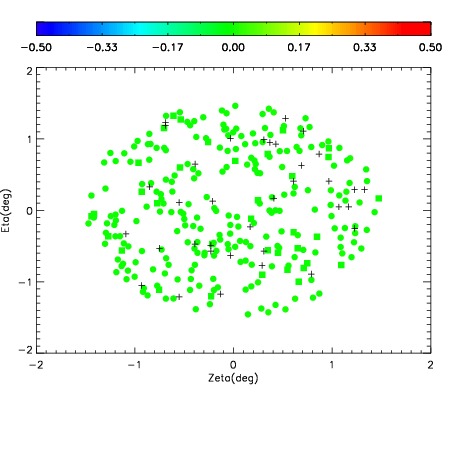


| Frame | Nreads | Zeropoints | Mag plots | Spatial mag deviation | Spatial sky 16325A emission deviations (filled: sky, open: star) | Spatial sky continuum emission | Spatial sky telluric CO2 absorption deviations (filled: H < 10) | |||||||||||||||||||||||
| 0 | 0 |
|
|
|
|
|
|
| IPAIR | NAME | SHIFT | NEWSHIFT | S/N | NAME | SHIFT | NEWSHIFT | S/N |
| 0 | 07510057 | 0.470085 | 0.00000 | 18.8438 | 07510055 | 0.000265351 | 0.469820 | 18.8073 |
| 1 | 07510056 | 0.469571 | 0.000514001 | 18.8359 | 07510058 | 0.000426521 | 0.469658 | 18.7910 |
| 2 | 07510048 | 0.468022 | 0.00206301 | 18.8193 | 07510054 | 0.00129725 | 0.468788 | 18.7579 |
| 3 | 07510049 | 0.468690 | 0.00139499 | 18.7840 | 07510050 | 0.00403098 | 0.466054 | 18.7466 |
| 4 | 07510053 | 0.469469 | 0.000615984 | 18.7223 | 07510047 | 0.00000 | 0.470085 | 18.7446 |
| 5 | 07510052 | 0.469231 | 0.000853986 | 18.6865 | 07510051 | 0.000438468 | 0.469647 | 18.7318 |