| Red | Green | Blue | |
| z | 17.65 | ||
| znorm | Inf | ||
| sky | -Inf | -Inf | -Inf |
| S/N | 8.1 | 16.3 | 16.5 |
| S/N(c) | 0.0 | 0.0 | 0.0 |
| SN(E/C) |
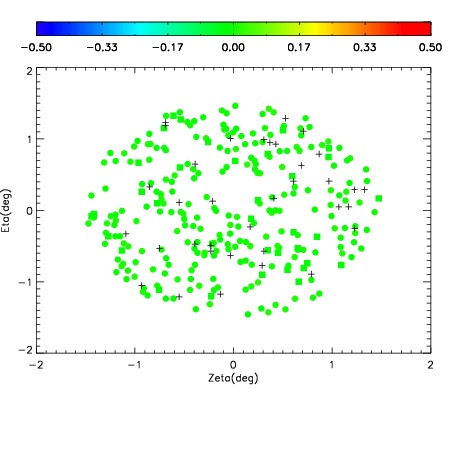


| Frame | Nreads | Zeropoints | Mag plots | Spatial mag deviation | Spatial sky 16325A emission deviations (filled: sky, open: star) | Spatial sky continuum emission | Spatial sky telluric CO2 absorption deviations (filled: H < 10) | |||||||||||||||||||||||
| 0 | 0 |
|
|
|
|
|
|
| IPAIR | NAME | SHIFT | NEWSHIFT | S/N | NAME | SHIFT | NEWSHIFT | S/N |
| 0 | 07880032 | 0.473025 | 0.00000 | 16.9841 | 07880033 | 0.00235404 | 0.470671 | 17.0158 |
| 1 | 07880027 | 0.469586 | 0.00343898 | 17.6739 | 07880026 | 0.00000 | 0.473025 | 17.9378 |
| 2 | 07880028 | 0.470570 | 0.00245500 | 17.2523 | 07880030 | -0.00107797 | 0.474103 | 17.4498 |
| 3 | 07880031 | 0.472223 | 0.000801980 | 16.9445 | 07880029 | -0.000317277 | 0.473342 | 16.9669 |