| Red | Green | Blue | |
| z | 17.64 | ||
| znorm | Inf | ||
| sky | -Inf | -NaN | -Inf |
| S/N | 27.6 | 49.0 | 52.0 |
| S/N(c) | 0.0 | 0.0 | 0.0 |
| SN(E/C) |
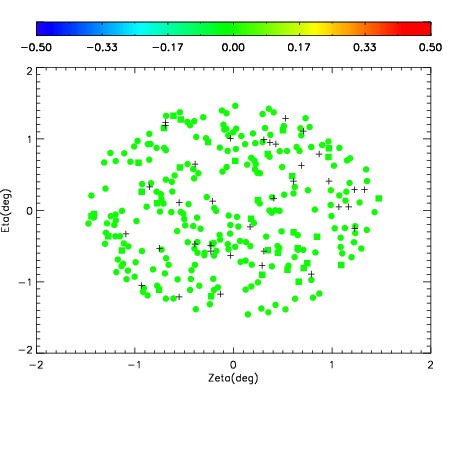
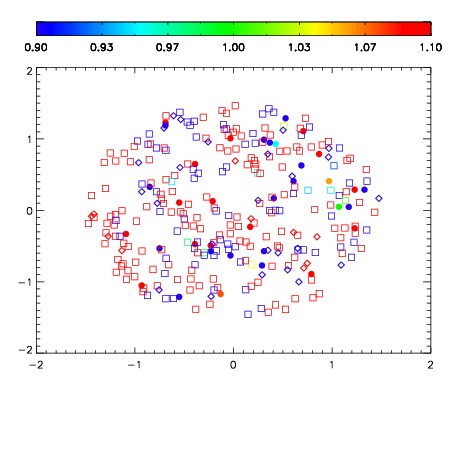
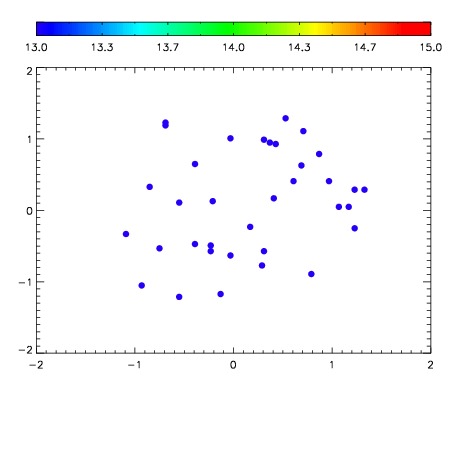

| Frame | Nreads | Zeropoints | Mag plots | Spatial mag deviation | Spatial sky 16325A emission deviations (filled: sky, open: star) | Spatial sky continuum emission | Spatial sky telluric CO2 absorption deviations (filled: H < 10) | |||||||||||||||||||||||
| 0 | 0 |
|
|
|
|
|
|
| IPAIR | NAME | SHIFT | NEWSHIFT | S/N | NAME | SHIFT | NEWSHIFT | S/N |
| 0 | 11100065 | 0.473131 | 0.00000 | 18.8941 | 11100062 | -0.00188296 | 0.475014 | 18.8079 |
| 1 | 11100064 | 0.473064 | 6.69956e-05 | 18.9764 | 11100059 | 0.00000 | 0.473131 | 18.9055 |
| 2 | 11100060 | 0.470724 | 0.00240701 | 18.9566 | 11100066 | -0.00220855 | 0.475340 | 18.8439 |
| 3 | 11100061 | 0.470733 | 0.00239801 | 18.8833 | 11100063 | -0.00194610 | 0.475077 | 18.7948 |