| Red | Green | Blue | |
| z | 17.64 | ||
| znorm | Inf | ||
| sky | -Inf | -NaN | -NaN |
| S/N | 19.6 | 35.6 | 37.5 |
| S/N(c) | 0.0 | 0.0 | 0.0 |
| SN(E/C) |
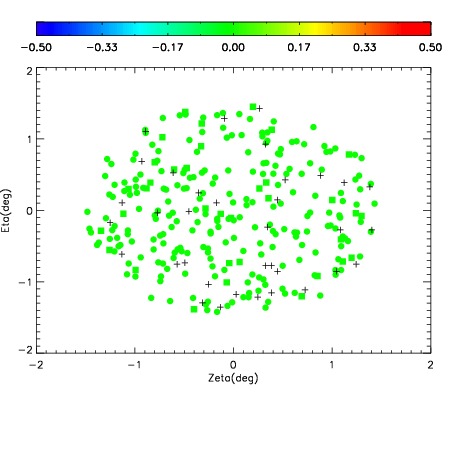
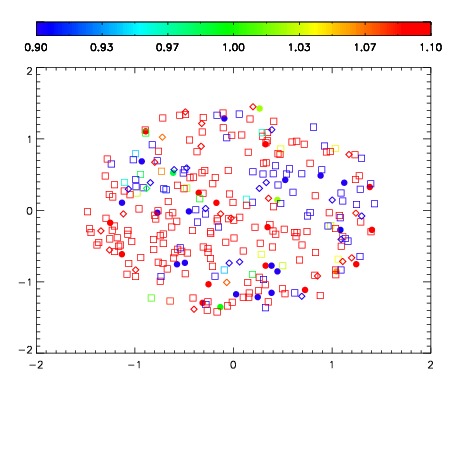
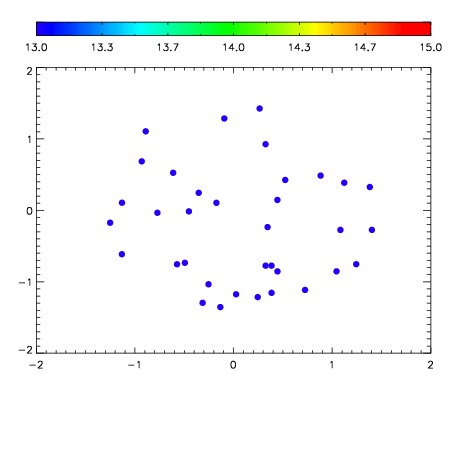

| Frame | Nreads | Zeropoints | Mag plots | Spatial mag deviation | Spatial sky 16325A emission deviations (filled: sky, open: star) | Spatial sky continuum emission | Spatial sky telluric CO2 absorption deviations (filled: H < 10) | |||||||||||||||||||||||
| 0 | 0 |
|
|
|
|
|
|
| IPAIR | NAME | SHIFT | NEWSHIFT | S/N | NAME | SHIFT | NEWSHIFT | S/N |
| 0 | 06770038 | 0.483852 | 0.00000 | 18.5459 | 06770039 | 0.00266804 | 0.481184 | 18.2313 |
| 1 | 06770042 | 0.483517 | 0.000335008 | 18.8737 | 06770036 | 0.00000 | 0.483852 | 19.0005 |
| 2 | 06770037 | 0.483696 | 0.000155985 | 18.6150 | 06770043 | 0.00324261 | 0.480609 | 18.6633 |
| 3 | 06770041 | 0.483164 | 0.000687987 | 18.3809 | 06770040 | 0.000445061 | 0.483407 | 18.0863 |