| Red | Green | Blue | |
| z | 17.64 | ||
| znorm | Inf | ||
| sky | -Inf | -NaN | -Inf |
| S/N | 28.1 | 47.9 | 51.7 |
| S/N(c) | 0.0 | 0.0 | 0.0 |
| SN(E/C) |
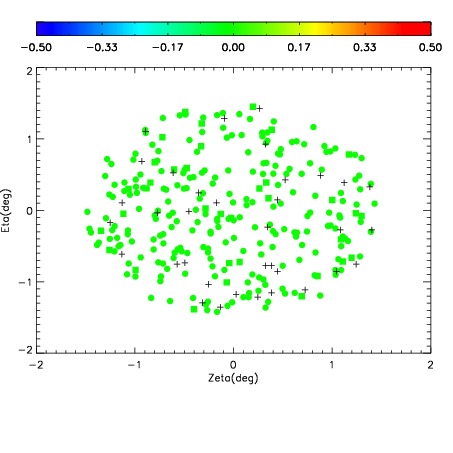
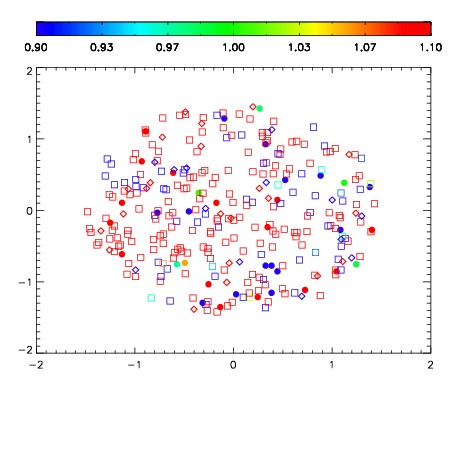
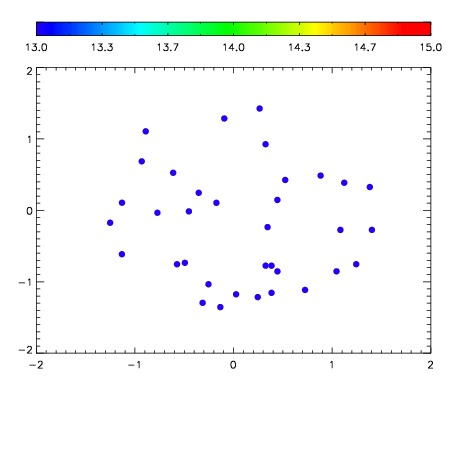

| Frame | Nreads | Zeropoints | Mag plots | Spatial mag deviation | Spatial sky 16325A emission deviations (filled: sky, open: star) | Spatial sky continuum emission | Spatial sky telluric CO2 absorption deviations (filled: H < 10) | |||||||||||||||||||||||
| 0 | 0 |
|
|
|
|
|
|
| IPAIR | NAME | SHIFT | NEWSHIFT | S/N | NAME | SHIFT | NEWSHIFT | S/N |
| 0 | 06970078 | 0.491879 | 0.00000 | 19.1590 | 06970076 | 0.000868959 | 0.491010 | 19.1844 |
| 1 | 06970074 | 0.489864 | 0.00201499 | 19.2022 | 06970075 | 0.000937607 | 0.490941 | 19.2065 |
| 2 | 06970073 | 0.489158 | 0.00272098 | 19.1674 | 06970079 | 0.00218878 | 0.489690 | 19.1911 |
| 3 | 06970077 | 0.490400 | 0.00147900 | 19.1304 | 06970072 | 0.00000 | 0.491879 | 19.1351 |