| Red | Green | Blue | |
| z | 17.64 | ||
| znorm | Inf | ||
| sky | -Inf | -NaN | -Inf |
| S/N | 29.3 | 52.2 | 52.7 |
| S/N(c) | 0.0 | 0.0 | 0.0 |
| SN(E/C) |
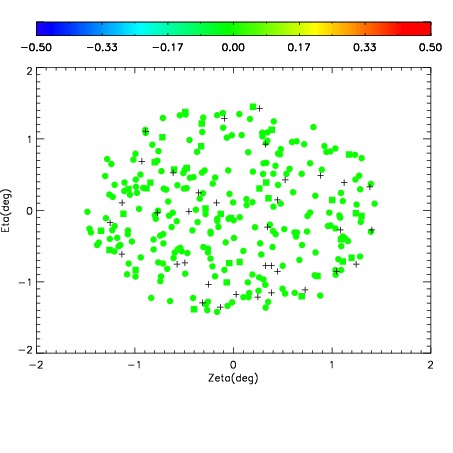
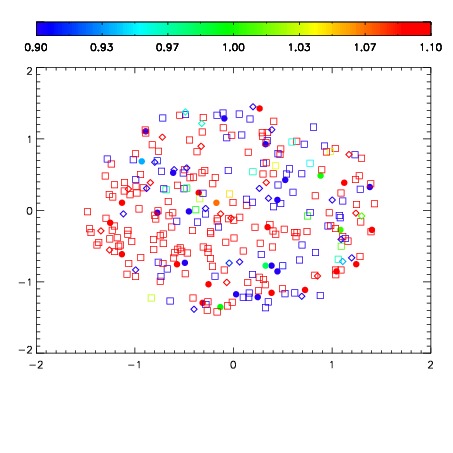
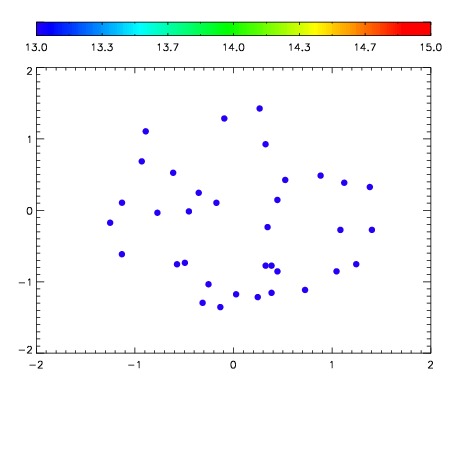

| Frame | Nreads | Zeropoints | Mag plots | Spatial mag deviation | Spatial sky 16325A emission deviations (filled: sky, open: star) | Spatial sky continuum emission | Spatial sky telluric CO2 absorption deviations (filled: H < 10) | |||||||||||||||||||||||
| 0 | 0 |
|
|
|
|
|
|
| IPAIR | NAME | SHIFT | NEWSHIFT | S/N | NAME | SHIFT | NEWSHIFT | S/N |
| 0 | 07030053 | 0.474746 | 0.00000 | 19.0179 | 07030055 | 0.000892170 | 0.473854 | 19.0681 |
| 1 | 07030048 | 0.470918 | 0.00382799 | 19.1076 | 07030050 | 0.00245917 | 0.472287 | 19.0865 |
| 2 | 07030049 | 0.471516 | 0.00322998 | 19.0835 | 07030047 | 0.00000 | 0.474746 | 19.0757 |
| 3 | 07030056 | 0.471868 | 0.00287798 | 19.0250 | 07030054 | 0.00217946 | 0.472567 | 19.0684 |
| 4 | 07030052 | 0.474007 | 0.000738978 | 18.9165 | 07030051 | 0.00317348 | 0.471573 | 19.0359 |