| Red | Green | Blue | |
| z | 17.64 | ||
| znorm | Inf | ||
| sky | -NaN | -NaN | -Inf |
| S/N | 25.9 | 44.8 | 46.4 |
| S/N(c) | 0.0 | 0.0 | 0.0 |
| SN(E/C) |
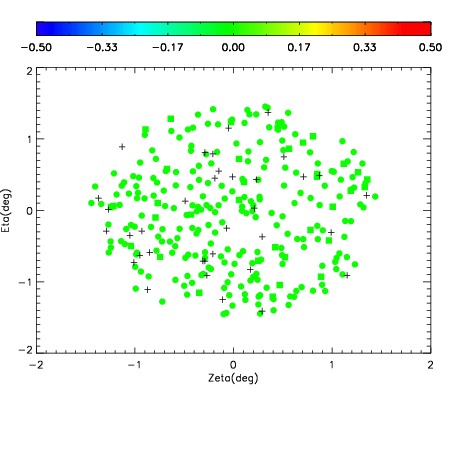
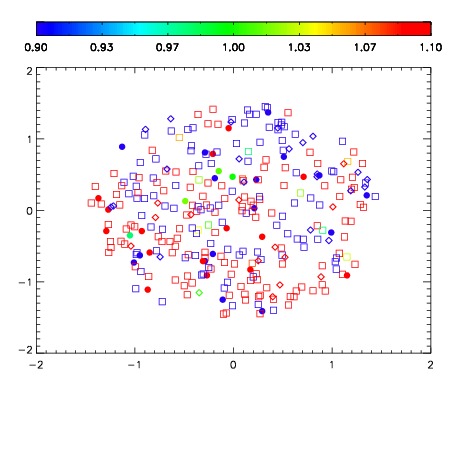
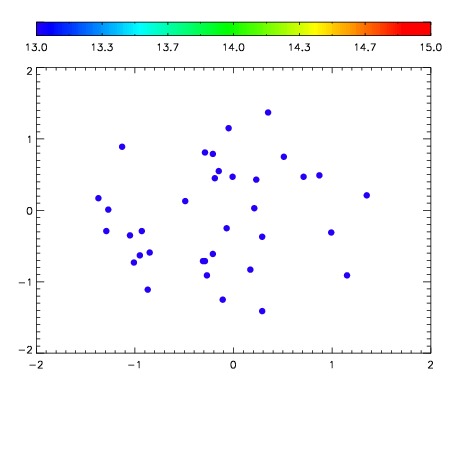

| Frame | Nreads | Zeropoints | Mag plots | Spatial mag deviation | Spatial sky 16325A emission deviations (filled: sky, open: star) | Spatial sky continuum emission | Spatial sky telluric CO2 absorption deviations (filled: H < 10) | |||||||||||||||||||||||
| 0 | 0 |
|
|
|
|
|
|
| IPAIR | NAME | SHIFT | NEWSHIFT | S/N | NAME | SHIFT | NEWSHIFT | S/N |
| 0 | 06740064 | 0.489321 | 0.00000 | 18.9434 | 06740058 | 0.00000 | 0.489321 | 18.6870 |
| 1 | 06740060 | 0.486527 | 0.00279400 | 19.0648 | 06740061 | -0.000658045 | 0.489979 | 18.9953 |
| 2 | 06740059 | 0.485550 | 0.00377101 | 19.0218 | 06740062 | 0.00281171 | 0.486509 | 18.9736 |
| 3 | 06740063 | 0.488964 | 0.000357002 | 18.9543 | 06740065 | 0.00219169 | 0.487129 | 18.7789 |