| Red | Green | Blue | |
| z | 17.64 | ||
| znorm | Inf | ||
| sky | -Inf | -Inf | -Inf |
| S/N | 33.2 | 53.9 | 60.7 |
| S/N(c) | 0.0 | 0.0 | 0.0 |
| SN(E/C) |
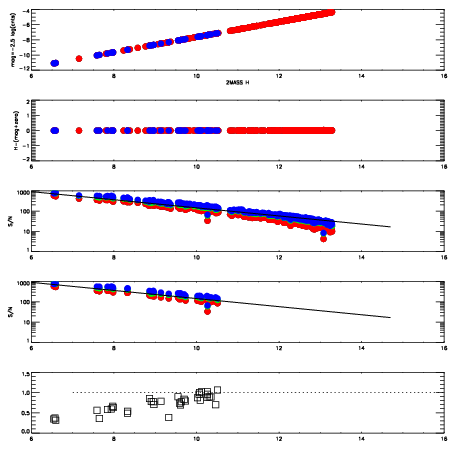
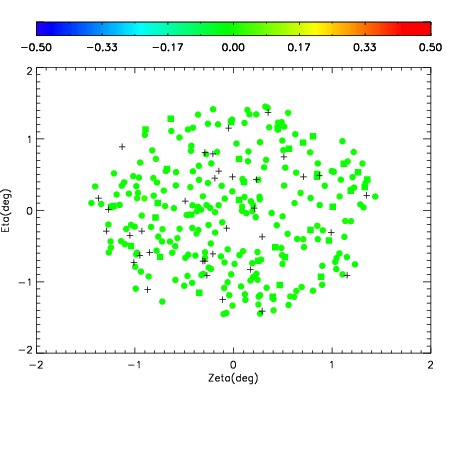
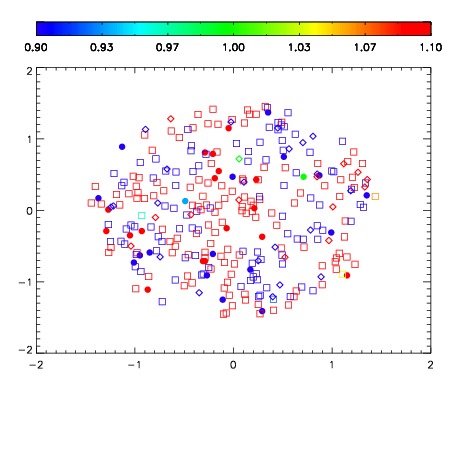
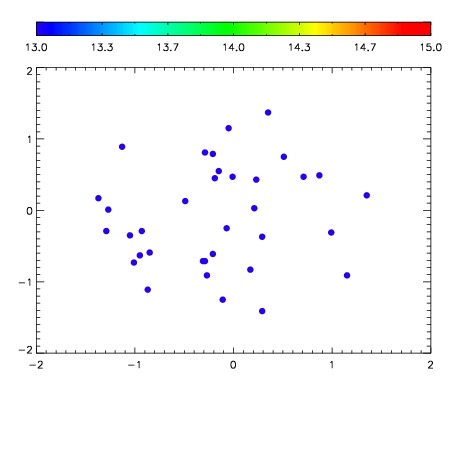

| Frame | Nreads | Zeropoints | Mag plots | Spatial mag deviation | Spatial sky 16325A emission deviations (filled: sky, open: star) | Spatial sky continuum emission | Spatial sky telluric CO2 absorption deviations (filled: H < 10) | |||||||||||||||||||||||
| 0 | 0 |
|
|
|
|
|
|
| IPAIR | NAME | SHIFT | NEWSHIFT | S/N | NAME | SHIFT | NEWSHIFT | S/N |
| 0 | 07000089 | 0.481740 | 0.00000 | 19.1541 | 07000094 | -0.00103717 | 0.482777 | 19.1501 |
| 1 | 07000093 | 0.479700 | 0.00204000 | 19.1304 | 07000090 | -0.00179539 | 0.483535 | 19.1331 |
| 2 | 07000085 | 0.481402 | 0.000337988 | 19.1280 | 07000083 | 0.00000 | 0.481740 | 19.0527 |
| 3 | 07000092 | 0.478241 | 0.00349900 | 19.0741 | 07000086 | 0.000474382 | 0.481266 | 19.0328 |
| 4 | 07000088 | 0.481240 | 0.000499994 | 19.0675 | 07000091 | -0.00459094 | 0.486331 | 19.0165 |
| 5 | 07000084 | 0.480999 | 0.000741005 | 19.0449 | 07000087 | -0.00115645 | 0.482896 | 18.9546 |