| Red | Green | Blue | |
| z | 17.64 | ||
| znorm | Inf | ||
| sky | -Inf | -Inf | -Inf |
| S/N | 34.7 | 56.7 | 62.8 |
| S/N(c) | 0.0 | 0.0 | 0.0 |
| SN(E/C) |
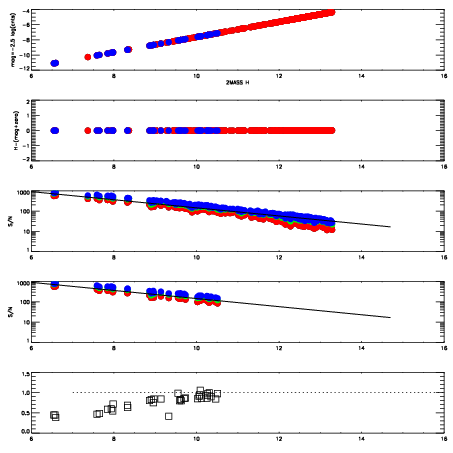
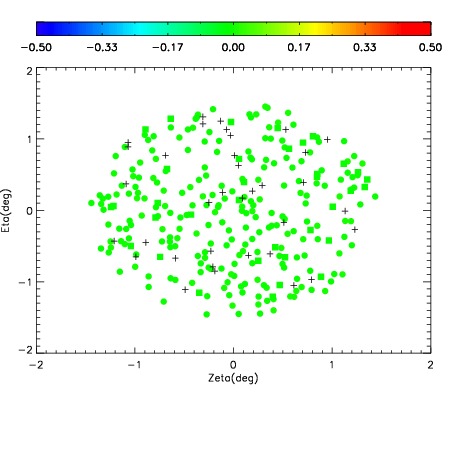
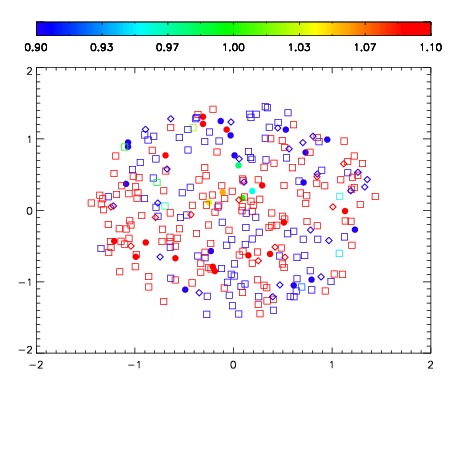


| Frame | Nreads | Zeropoints | Mag plots | Spatial mag deviation | Spatial sky 16325A emission deviations (filled: sky, open: star) | Spatial sky continuum emission | Spatial sky telluric CO2 absorption deviations (filled: H < 10) | |||||||||||||||||||||||
| 0 | 0 |
|
|
|
|
|
|
| IPAIR | NAME | SHIFT | NEWSHIFT | S/N | NAME | SHIFT | NEWSHIFT | S/N |
| 0 | 06950092 | 0.500645 | 0.00000 | 19.1911 | 06950093 | 0.00888257 | 0.491762 | 19.1877 |
| 1 | 06950091 | 0.499531 | 0.00111398 | 19.1799 | 06950089 | 0.00713098 | 0.493514 | 19.1769 |
| 2 | 06950088 | 0.498422 | 0.00222299 | 19.1663 | 06950090 | 0.00584520 | 0.494800 | 19.1611 |
| 3 | 06950087 | 0.497189 | 0.00345600 | 19.1459 | 06950086 | 0.00478280 | 0.495862 | 19.1521 |
| 4 | 06950084 | 0.498035 | 0.00260997 | 19.0744 | 06950085 | 0.00659788 | 0.494047 | 19.1187 |
| 5 | 06950083 | 0.497676 | 0.00296897 | 19.0437 | 06950082 | 0.00000 | 0.500645 | 19.0011 |