| Red | Green | Blue | |
| z | 17.64 | ||
| znorm | Inf | ||
| sky | -Inf | -Inf | -Inf |
| S/N | 22.8 | 39.2 | 43.6 |
| S/N(c) | 0.0 | 0.0 | 0.0 |
| SN(E/C) |
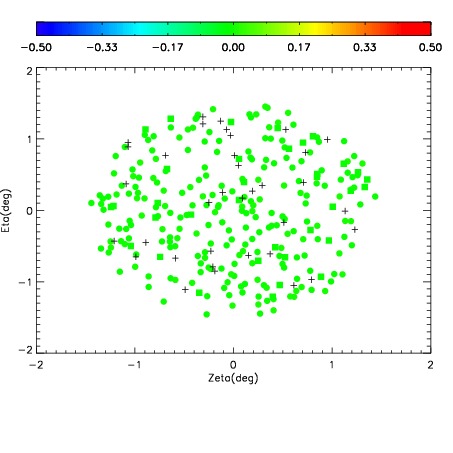
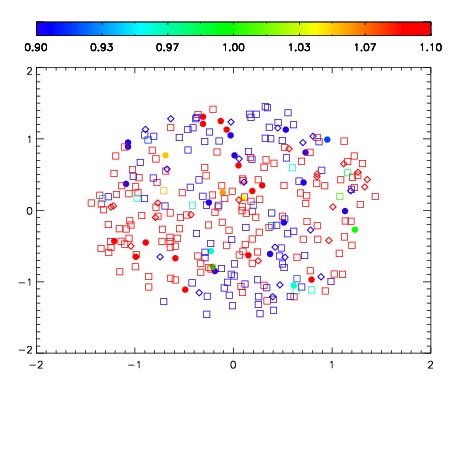
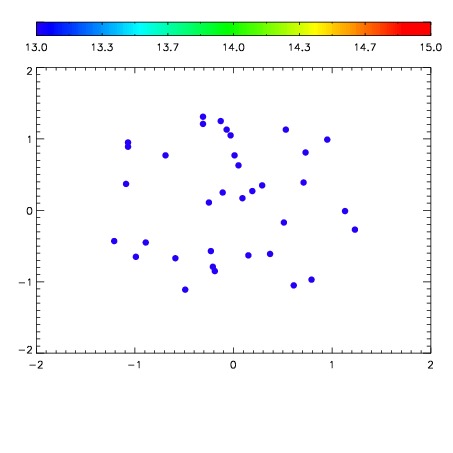

| Frame | Nreads | Zeropoints | Mag plots | Spatial mag deviation | Spatial sky 16325A emission deviations (filled: sky, open: star) | Spatial sky continuum emission | Spatial sky telluric CO2 absorption deviations (filled: H < 10) | |||||||||||||||||||||||
| 0 | 0 |
|
|
|
|
|
|
| IPAIR | NAME | SHIFT | NEWSHIFT | S/N | NAME | SHIFT | NEWSHIFT | S/N |
| 0 | 07020065 | 0.478480 | 0.00000 | 18.9205 | 07020066 | 0.00365405 | 0.474826 | 18.9545 |
| 1 | 07020060 | 0.474084 | 0.00439602 | 18.9462 | 07020059 | 0.00000 | 0.478480 | 18.9686 |
| 2 | 07020061 | 0.475130 | 0.00335002 | 18.9147 | 07020062 | 0.00245805 | 0.476022 | 18.9077 |
| 3 | 07020064 | 0.477900 | 0.000580013 | 18.8714 | 07020063 | 0.00211588 | 0.476364 | 18.8494 |