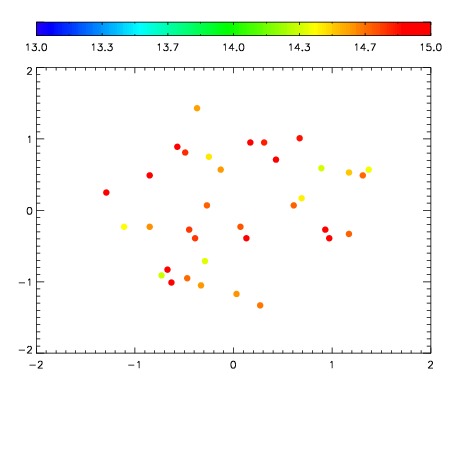
| Frame | Nreads | Zeropoints | Mag plots
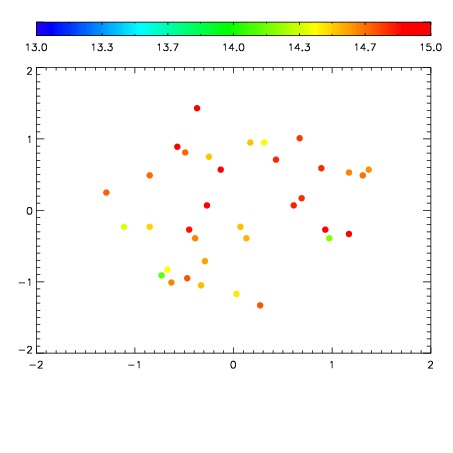
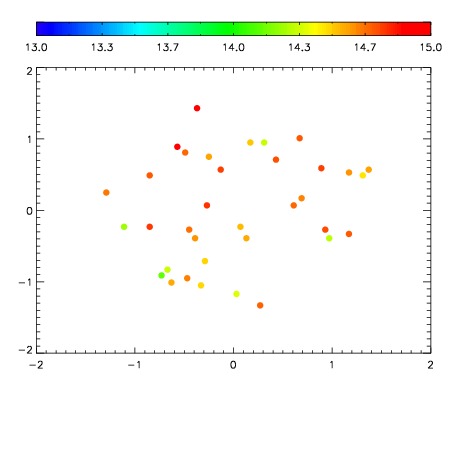
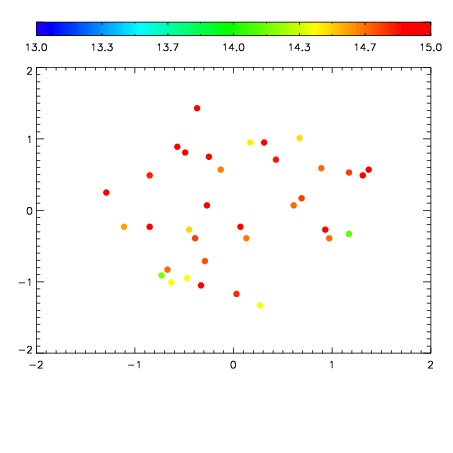
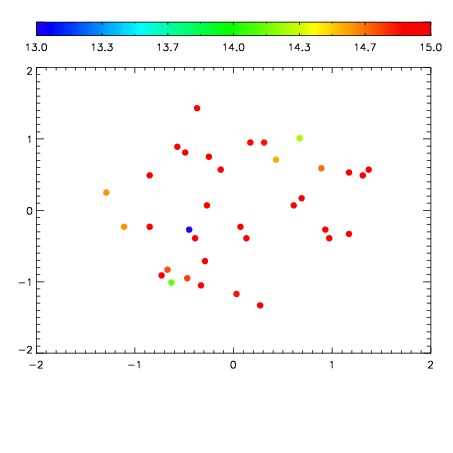
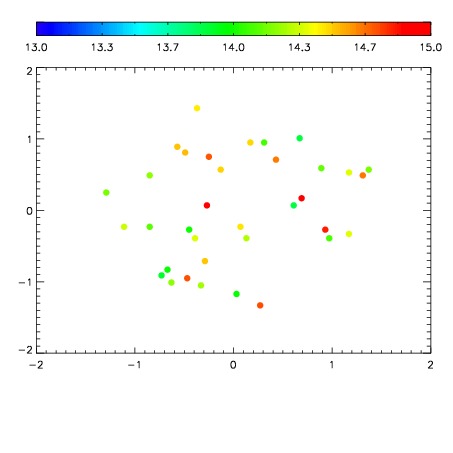
| Spatial mag deviation
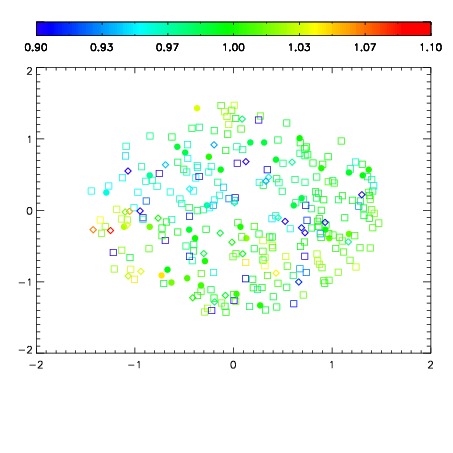
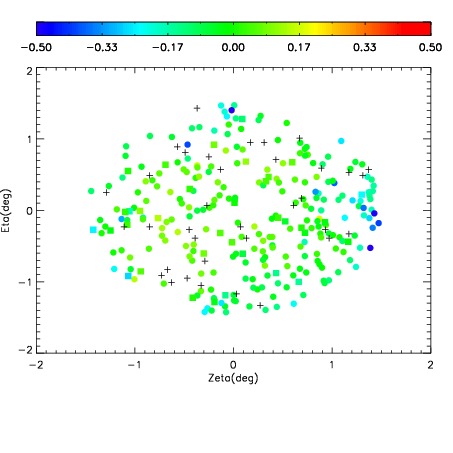
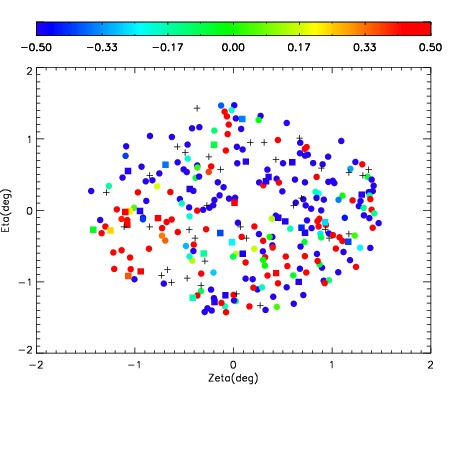
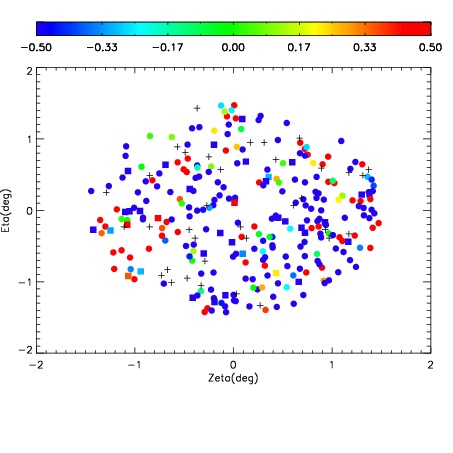
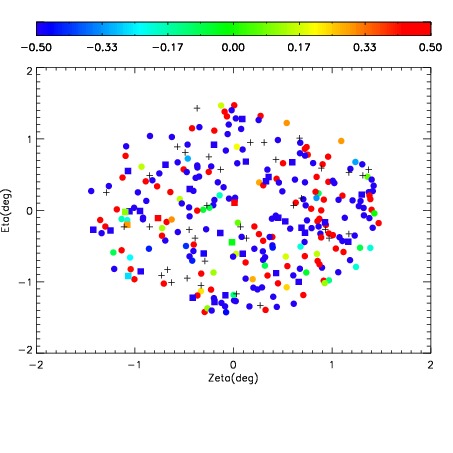
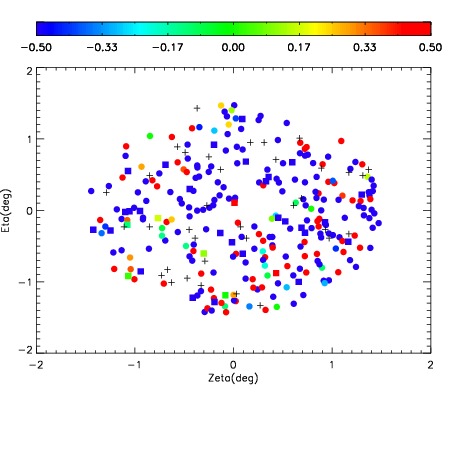
| Spatial sky 16325A emission deviations (filled: sky, open: star)
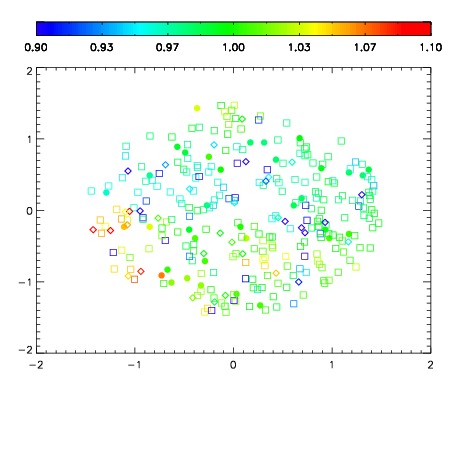
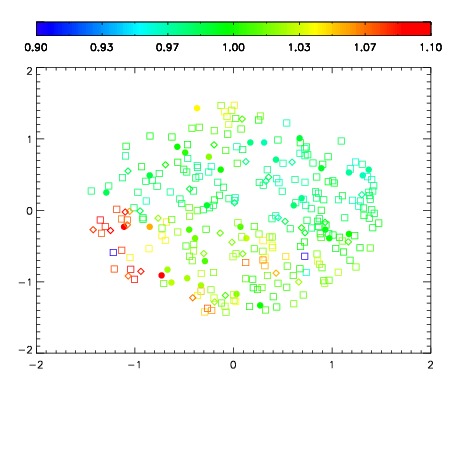
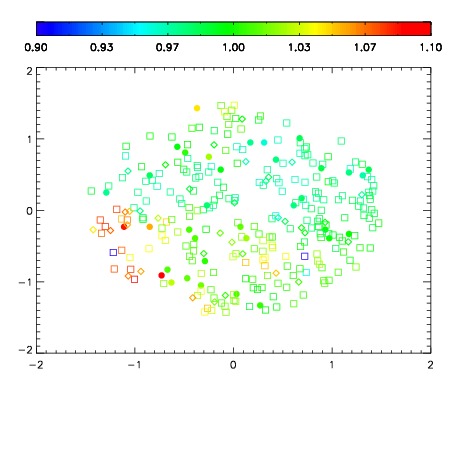
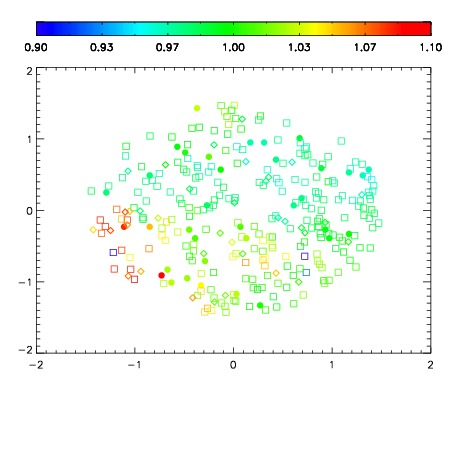
| Spatial sky continuum emission
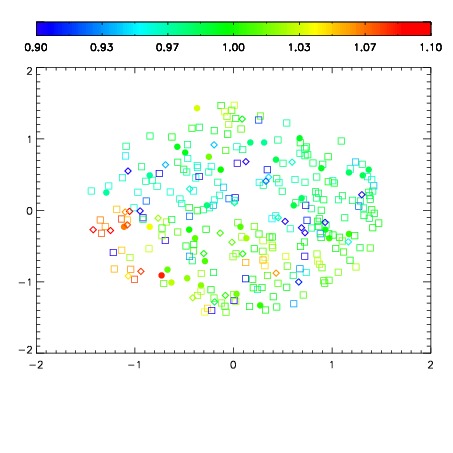
| Spatial sky telluric CO2 absorption deviations (filled: H < 10)
|
| 6470030
| 47
| | Red | Green | Blue
| | z | | 19.10
| | znorm | | 14.92
| | sky | 14.9 | 14.7 | 14.6
| | S/N | 16.7 | 26.7 | 27.2
| | S/N(c) | 17.5 | 27.8 | 47.7
| | SN(E/C) 0.88
|
| 
| 
| 
| 
| 
|
| 6470031
| 47
| | Red | Green | Blue
| | z | | 19.11
| | znorm | | 14.93
| | sky | 14.9 | 14.6 | 15.0
| | S/N | 16.7 | 26.9 | 28.0
| | S/N(c) | 17.7 | 28.0 | 48.3
| | SN(E/C) 0.86
|
| 
| 
| 
| 
| 
|
| 6470032
| 47
| | Red | Green | Blue
| | z | | 19.14
| | znorm | | 14.96
| | sky | 14.6 | 14.6 | 14.9
| | S/N | 17.0 | 27.4 | 28.8
| | S/N(c) | 17.9 | 28.7 | 48.7
| | SN(E/C) 0.87
|
| 
| 
| 
| 
| 
|
| 6470033
| 47
| | Red | Green | Blue
| | z | | 19.13
| | znorm | | 14.95
| | sky | 14.8 | 14.6 | 15.0
| | S/N | 16.9 | 27.4 | 29.0
| | S/N(c) | 17.8 | 28.6 | 48.8
| | SN(E/C) 0.86
|
| 
| 
| 
| 
| 
|
| 6470034
| 14
| | Red | Green | Blue
| | z | | 13.47
| | znorm | | 10.60
| | sky | 14.0 | 14.8 | 17.3
| | S/N | -0.0 | 0.2 | 0.3
| | S/N(c) | 0.0 | 0.0 | 0.0
| | SN(E/C) 1.18
|
| 
| 
| 
| 
| 
|
| 6470035
| 14
| | Red | Green | Blue
| | z | | 13.17
| | znorm | | 10.30
| | sky | 14.2 | 14.7 | 15.0
| | S/N | -0.0 | 0.2 | 0.1
| | S/N(c) | 0.0 | 0.0 | 0.0
| | SN(E/C) 1.28
|
| 
| 
| 
| 
| 
|
| 6470036
| 14
| | Red | Green | Blue
| | z | | 13.28
| | znorm | | 10.41
| | sky | -NaN | 15.2 | 14.6
| | S/N | -0.0 | 0.2 | 0.2
| | S/N(c) | 0.0 | 0.0 | 0.0
| | SN(E/C) 1.11
|
| 
| 
| 
| 
| 
|
| 6470037
| 14
| | Red | Green | Blue
| | z | | 13.22
| | znorm | | 10.35
| | sky | 14.2 | 14.4 | 15.2
| | S/N | -0.0 | 0.1 | 0.0
| | S/N(c) | 0.0 | 0.0 | 0.0
| | SN(E/C) 1.67
|
| 
| 
| 
| 
| 
|