| Red | Green | Blue | |
| z | 17.64 | ||
| znorm | Inf | ||
| sky | -Inf | -NaN | -Inf |
| S/N | 31.5 | 51.5 | 56.5 |
| S/N(c) | 0.0 | 0.0 | 0.0 |
| SN(E/C) |
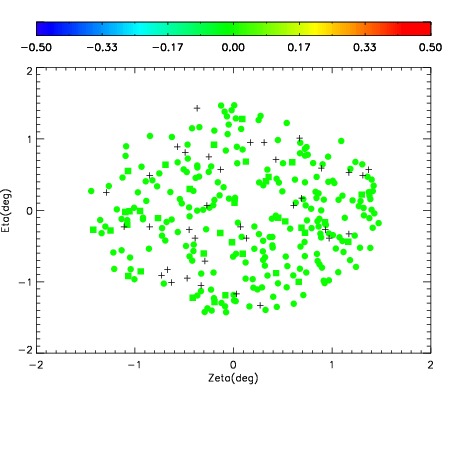
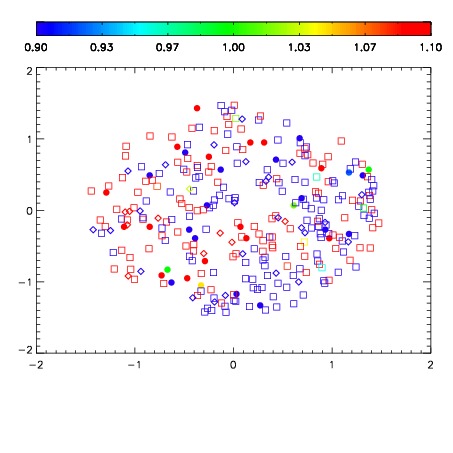
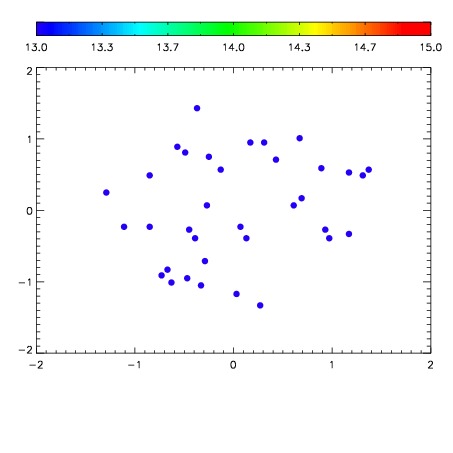

| Frame | Nreads | Zeropoints | Mag plots | Spatial mag deviation | Spatial sky 16325A emission deviations (filled: sky, open: star) | Spatial sky continuum emission | Spatial sky telluric CO2 absorption deviations (filled: H < 10) | |||||||||||||||||||||||
| 0 | 0 |
|
|
|
|
|
|
| IPAIR | NAME | SHIFT | NEWSHIFT | S/N | NAME | SHIFT | NEWSHIFT | S/N |
| 0 | 06730061 | 0.492459 | 0.00000 | 19.1714 | 06730063 | -0.000633073 | 0.493092 | 19.1986 |
| 1 | 06730060 | 0.491050 | 0.00140899 | 19.1922 | 06730062 | -0.000184688 | 0.492644 | 19.2030 |
| 2 | 06730064 | 0.489727 | 0.00273201 | 19.1710 | 06730066 | 0.00806666 | 0.484392 | 19.1859 |
| 3 | 06730065 | 0.492339 | 0.000120014 | 19.1663 | 06730059 | 0.00000 | 0.492459 | 19.1679 |