| Red | Green | Blue | |
| z | 17.64 | ||
| znorm | Inf | ||
| sky | -Inf | -Inf | -Inf |
| S/N | 28.2 | 45.8 | 49.6 |
| S/N(c) | 0.0 | 0.0 | 0.0 |
| SN(E/C) |
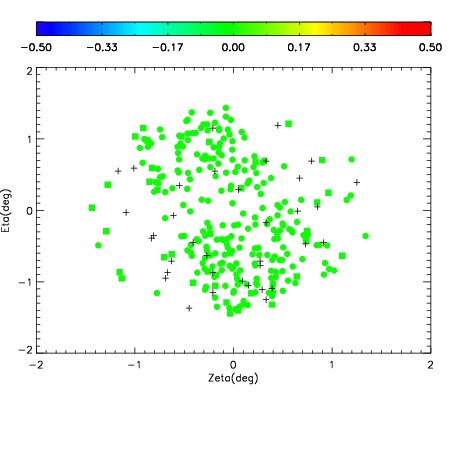
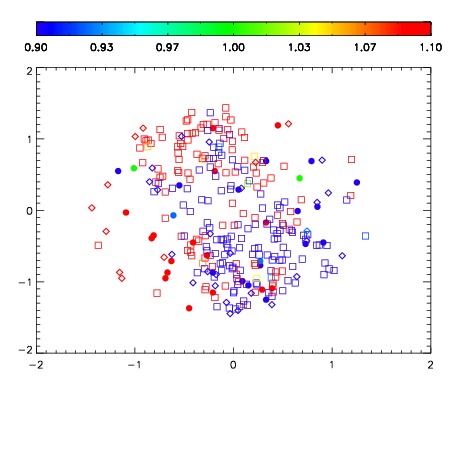
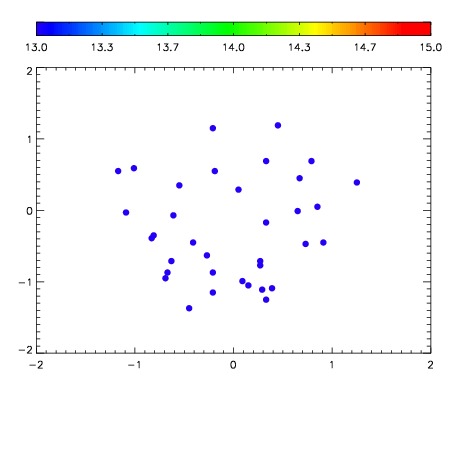

| Frame | Nreads | Zeropoints | Mag plots | Spatial mag deviation | Spatial sky 16325A emission deviations (filled: sky, open: star) | Spatial sky continuum emission | Spatial sky telluric CO2 absorption deviations (filled: H < 10) | |||||||||||||||||||||||
| 0 | 0 |
|
|
|
|
|
|
| IPAIR | NAME | SHIFT | NEWSHIFT | S/N | NAME | SHIFT | NEWSHIFT | S/N |
| 0 | 06330015 | 0.468100 | 0.00000 | 19.2411 | 06330016 | -0.00546720 | 0.473567 | 19.1915 |
| 1 | 06330014 | 0.467259 | 0.000841022 | 19.1747 | 06330013 | -0.00714071 | 0.475241 | 19.0519 |
| 2 | 06330010 | 0.466577 | 0.00152302 | 19.0550 | 06330012 | -0.00727630 | 0.475376 | 19.0372 |
| 3 | 06330011 | 0.467642 | 0.000458002 | 18.9538 | 06330009 | 0.00000 | 0.468100 | 18.5346 |