| Red | Green | Blue | |
| z | 17.64 | ||
| znorm | Inf | ||
| sky | -Inf | -NaN | -Inf |
| S/N | 33.9 | 54.8 | 59.1 |
| S/N(c) | 0.0 | 0.0 | 0.0 |
| SN(E/C) |
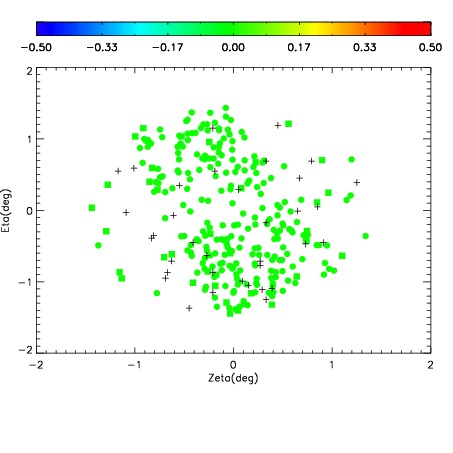
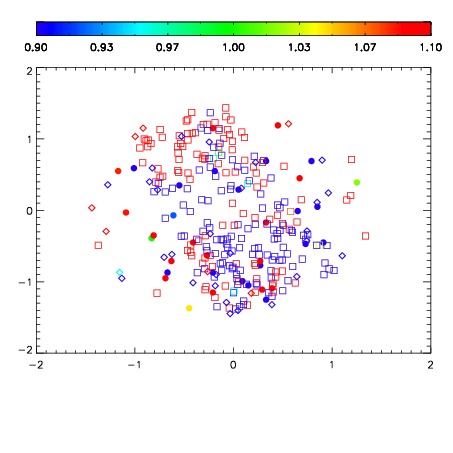
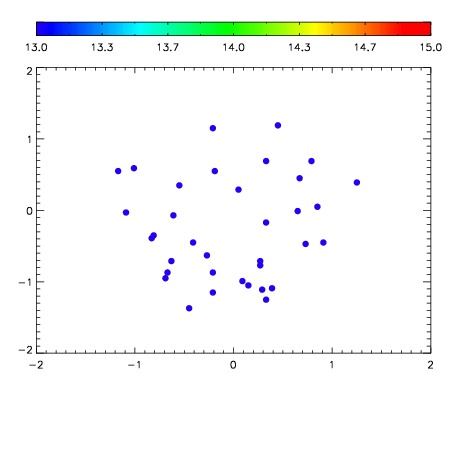

| Frame | Nreads | Zeropoints | Mag plots | Spatial mag deviation | Spatial sky 16325A emission deviations (filled: sky, open: star) | Spatial sky continuum emission | Spatial sky telluric CO2 absorption deviations (filled: H < 10) | |||||||||||||||||||||||
| 0 | 0 |
|
|
|
|
|
|
| IPAIR | NAME | SHIFT | NEWSHIFT | S/N | NAME | SHIFT | NEWSHIFT | S/N |
| 0 | 06340016 | 0.472790 | 0.00000 | 19.2949 | 06340017 | -0.000487601 | 0.473278 | 19.2929 |
| 1 | 06340015 | 0.472761 | 2.89977e-05 | 19.2855 | 06340014 | -0.000680616 | 0.473471 | 19.2868 |
| 2 | 06340012 | 0.471638 | 0.00115201 | 19.2726 | 06340013 | 0.00136102 | 0.471429 | 19.2755 |
| 3 | 06340011 | 0.470499 | 0.00229099 | 19.2616 | 06340010 | 0.00000 | 0.472790 | 19.2234 |