| Red | Green | Blue | |
| z | 17.64 | ||
| znorm | Inf | ||
| sky | -Inf | -Inf | -Inf |
| S/N | 29.1 | 49.0 | 51.2 |
| S/N(c) | 0.0 | 0.0 | 0.0 |
| SN(E/C) |
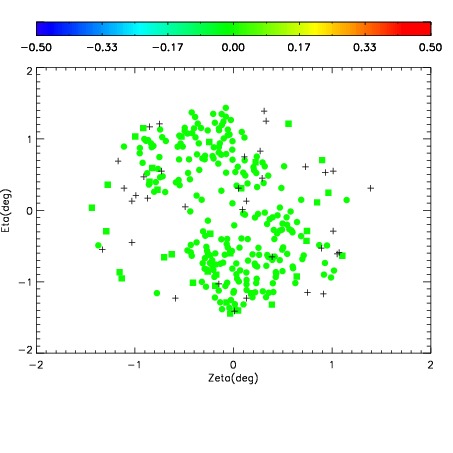


| Frame | Nreads | Zeropoints | Mag plots | Spatial mag deviation | Spatial sky 16325A emission deviations (filled: sky, open: star) | Spatial sky continuum emission | Spatial sky telluric CO2 absorption deviations (filled: H < 10) | |||||||||||||||||||||||
| 0 | 0 |
|
|
|
|
|
|
| IPAIR | NAME | SHIFT | NEWSHIFT | S/N | NAME | SHIFT | NEWSHIFT | S/N |
| 0 | 06390013 | 0.483288 | 0.00000 | 19.0102 | 06390014 | -0.000848439 | 0.484136 | 18.9879 |
| 1 | 06390012 | 0.483098 | 0.000189990 | 19.0452 | 06390018 | 0.000145782 | 0.483142 | 19.1228 |
| 2 | 06390017 | 0.480318 | 0.00296998 | 19.0113 | 06390015 | 4.64345e-05 | 0.483242 | 18.9929 |
| 3 | 06390016 | 0.480058 | 0.00322998 | 19.0025 | 06390011 | 0.00000 | 0.483288 | 18.9664 |