| Red | Green | Blue | |
| z | 17.64 | ||
| znorm | Inf | ||
| sky | -Inf | -Inf | -Inf |
| S/N | 25.1 | 43.7 | 45.4 |
| S/N(c) | 0.0 | 0.0 | 0.0 |
| SN(E/C) |

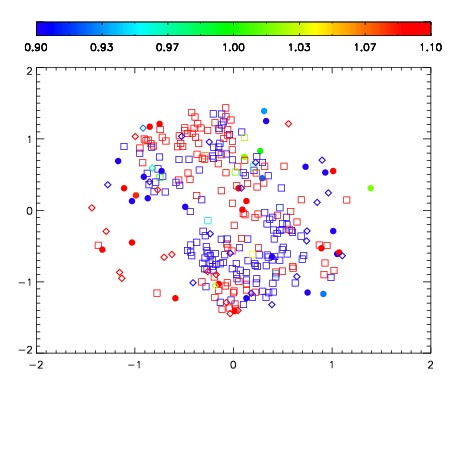


| Frame | Nreads | Zeropoints | Mag plots | Spatial mag deviation | Spatial sky 16325A emission deviations (filled: sky, open: star) | Spatial sky continuum emission | Spatial sky telluric CO2 absorption deviations (filled: H < 10) | |||||||||||||||||||||||
| 0 | 0 |
|
|
|
|
|
|
| IPAIR | NAME | SHIFT | NEWSHIFT | S/N | NAME | SHIFT | NEWSHIFT | S/N |
| 0 | 06400014 | 0.467792 | 0.00000 | 18.8724 | 06400015 | -0.00972704 | 0.477519 | 18.8605 |
| 1 | 06400017 | 0.467351 | 0.000441015 | 18.9561 | 06400016 | -0.000431293 | 0.468223 | 18.8942 |
| 2 | 06400018 | 0.467718 | 7.39992e-05 | 18.8930 | 06400019 | -0.00973763 | 0.477530 | 18.8901 |
| 3 | 06400013 | 0.467509 | 0.000283003 | 18.7702 | 06400012 | 0.00000 | 0.467792 | 18.7371 |