| Red | Green | Blue | |
| z | 17.64 | ||
| znorm | Inf | ||
| sky | -Inf | -Inf | -Inf |
| S/N | 33.8 | 54.4 | 58.3 |
| S/N(c) | 0.0 | 0.0 | 0.0 |
| SN(E/C) |
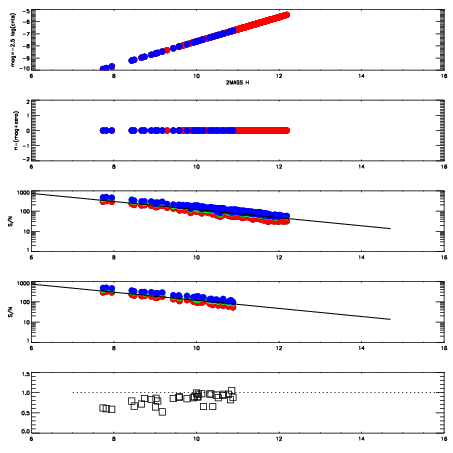
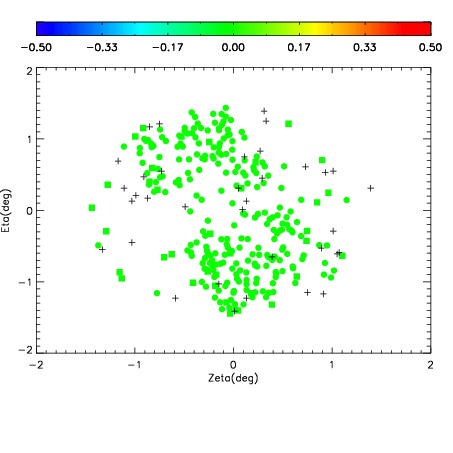
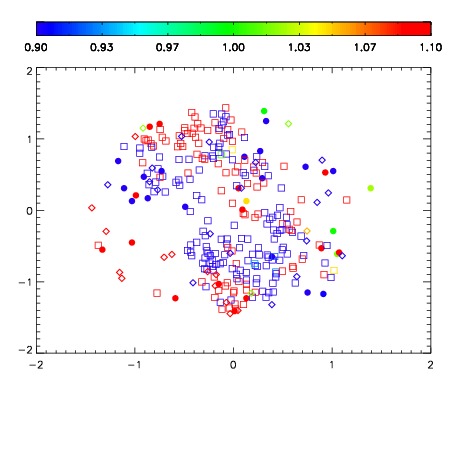


| Frame | Nreads | Zeropoints | Mag plots | Spatial mag deviation | Spatial sky 16325A emission deviations (filled: sky, open: star) | Spatial sky continuum emission | Spatial sky telluric CO2 absorption deviations (filled: H < 10) | |||||||||||||||||||||||
| 0 | 0 |
|
|
|
|
|
|
| IPAIR | NAME | SHIFT | NEWSHIFT | S/N | NAME | SHIFT | NEWSHIFT | S/N |
| 0 | 06410016 | 0.479957 | 0.00000 | 19.2605 | 06410014 | 0.000274343 | 0.479683 | 19.2667 |
| 1 | 06410012 | 0.479440 | 0.000517011 | 19.2486 | 06410013 | -0.000754047 | 0.480711 | 19.2572 |
| 2 | 06410015 | 0.479405 | 0.000552028 | 19.2421 | 06410017 | 0.00253783 | 0.477419 | 19.2501 |
| 3 | 06410011 | 0.478960 | 0.000997007 | 19.2328 | 06410010 | 0.00000 | 0.479957 | 19.2242 |