| Red | Green | Blue | |
| z | 17.64 | ||
| znorm | Inf | ||
| sky | -NaN | -NaN | -Inf |
| S/N | 29.6 | 50.5 | 52.9 |
| S/N(c) | 0.0 | 0.0 | 0.0 |
| SN(E/C) |
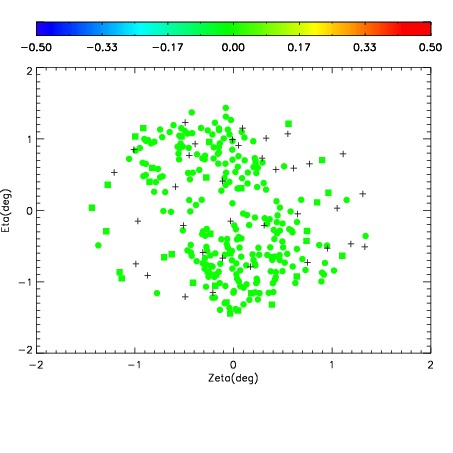
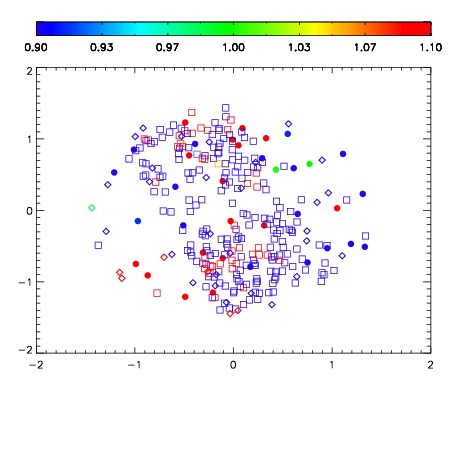
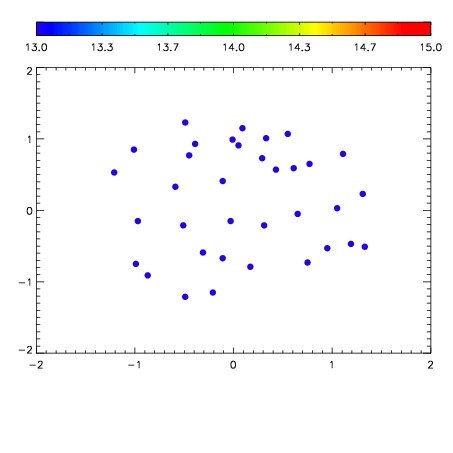

| Frame | Nreads | Zeropoints | Mag plots | Spatial mag deviation | Spatial sky 16325A emission deviations (filled: sky, open: star) | Spatial sky continuum emission | Spatial sky telluric CO2 absorption deviations (filled: H < 10) | |||||||||||||||||||||||
| 0 | 0 |
|
|
|
|
|
|
| IPAIR | NAME | SHIFT | NEWSHIFT | S/N | NAME | SHIFT | NEWSHIFT | S/N |
| 0 | 08720039 | 0.473776 | 0.00000 | 19.0645 | 08720036 | 0.00275283 | 0.471023 | 19.0340 |
| 1 | 08720038 | 0.473353 | 0.000423014 | 19.0946 | 08720040 | -7.10413e-06 | 0.473783 | 19.1014 |
| 2 | 08720034 | 0.470085 | 0.00369102 | 19.0717 | 08720037 | 0.00372739 | 0.470049 | 19.0909 |
| 3 | 08720035 | 0.471178 | 0.00259802 | 19.0670 | 08720033 | 0.00000 | 0.473776 | 19.0673 |