| Red | Green | Blue | |
| z | 17.64 | ||
| znorm | Inf | ||
| sky | -Inf | -Inf | -Inf |
| S/N | 18.2 | 31.7 | 36.0 |
| S/N(c) | 0.0 | 0.0 | 0.0 |
| SN(E/C) |
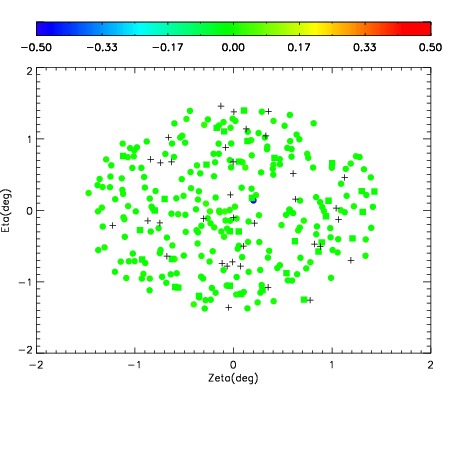
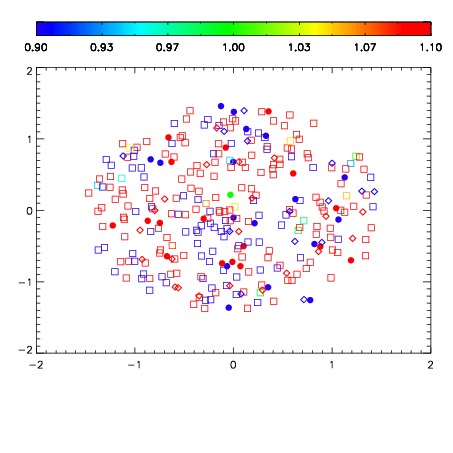


| Frame | Nreads | Zeropoints | Mag plots | Spatial mag deviation | Spatial sky 16325A emission deviations (filled: sky, open: star) | Spatial sky continuum emission | Spatial sky telluric CO2 absorption deviations (filled: H < 10) | |||||||||||||||||||||||
| 0 | 0 |
|
|
|
|
|
|
| IPAIR | NAME | SHIFT | NEWSHIFT | S/N | NAME | SHIFT | NEWSHIFT | S/N |
| 0 | 07220028 | 0.480421 | 0.00000 | 18.5233 | 07220022 | 0.00000 | 0.480421 | 18.4778 |
| 1 | 07220027 | 0.480307 | 0.000113994 | 18.6892 | 07220026 | 0.00347561 | 0.476945 | 18.5455 |
| 2 | 07220024 | 0.480062 | 0.000358999 | 18.6518 | 07220025 | 0.000739481 | 0.479682 | 18.5296 |
| 3 | 07220023 | 0.479378 | 0.00104299 | 18.3723 | 07220029 | 0.00395167 | 0.476469 | 18.4632 |