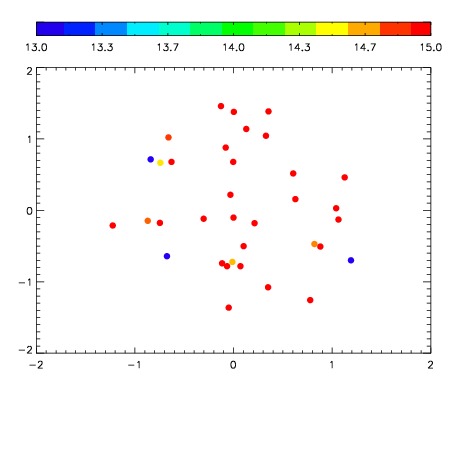
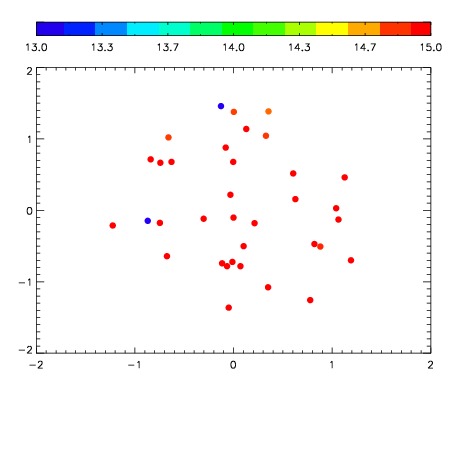
| Frame | Nreads | Zeropoints | Mag plots
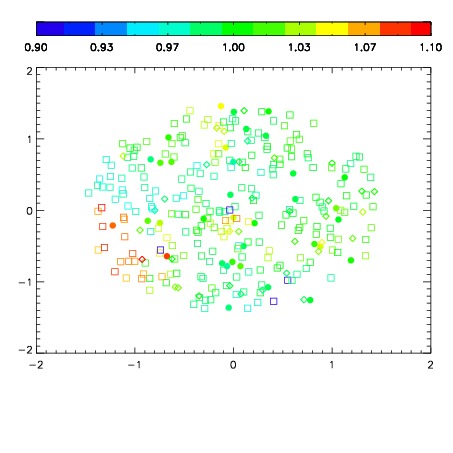
| Spatial mag deviation
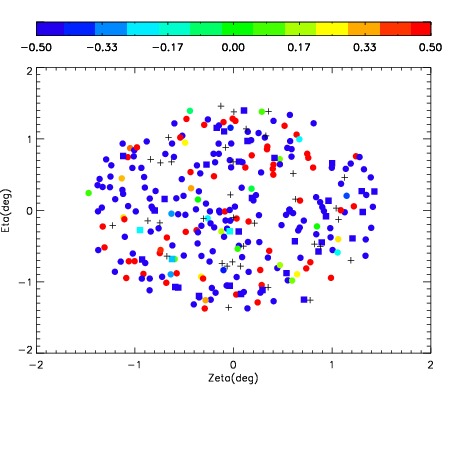
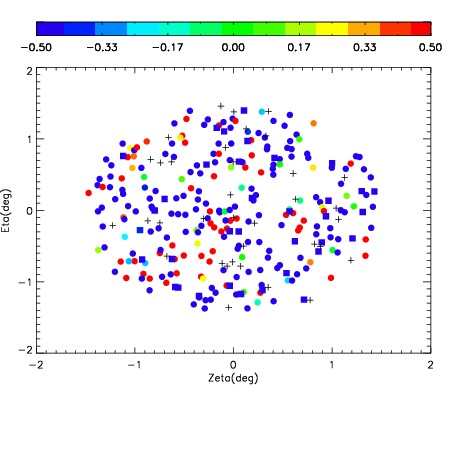
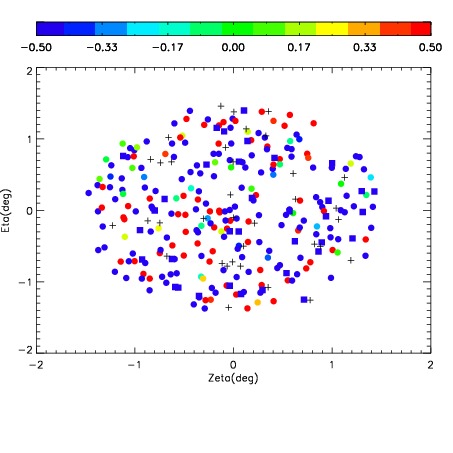
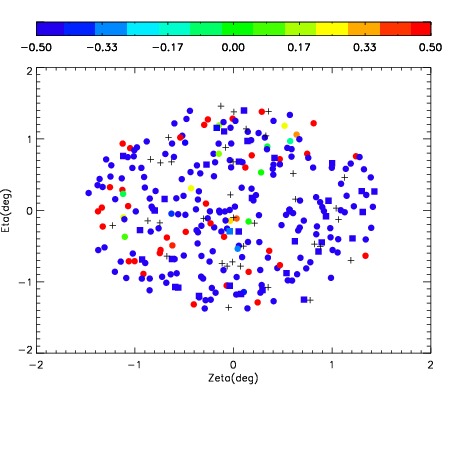
| Spatial sky 16325A emission deviations (filled: sky, open: star)
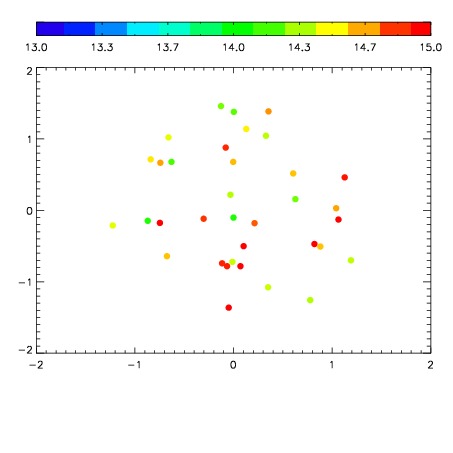
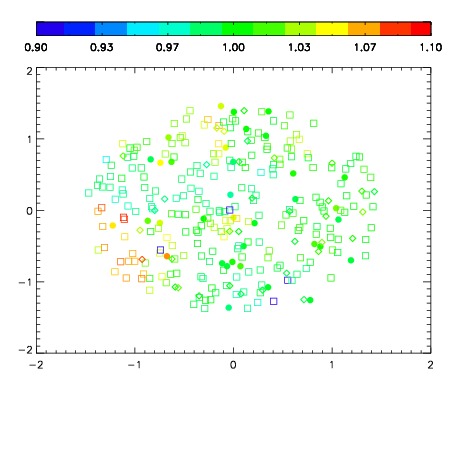
| Spatial sky continuum emission
| Spatial sky telluric CO2 absorption deviations (filled: H < 10)
|
| 9980068
| 14
| | Red | Green | Blue
| | z | | 14.24
| | znorm | | 11.37
| | sky | 15.2 | 14.5 | 14.8
| | S/N | 0.1 | 0.1 | 1.1
| | S/N(c) | 0.0 | 0.0 | 0.0
| | SN(E/C) 1.54
|
| 
| 
| 
| 
| 
|
| 9980069
| 14
| | Red | Green | Blue
| | z | | 14.15
| | znorm | | 11.29
| | sky | 15.9 | 15.5 | 15.7
| | S/N | -0.0 | 0.1 | 0.7
| | S/N(c) | 0.0 | 0.0 | 0.0
| | SN(E/C) 0.84
|
| 
| 
| 
| 
| 
|
| 9980070
| 14
| | Red | Green | Blue
| | z | | 14.29
| | znorm | | 11.42
| | sky | 15.0 | 15.6 | 14.8
| | S/N | 0.1 | 0.2 | 0.6
| | S/N(c) | 0.0 | 0.0 | 0.0
| | SN(E/C) 0.98
|
| 
| 
| 
| 
| 
|
| 9980071
| 14
| | Red | Green | Blue
| | z | | 13.99
| | znorm | | 11.13
| | sky | 14.6 | 14.8 | 14.9
| | S/N | -0.1 | 0.2 | 0.5
| | S/N(c) | 0.0 | 0.0 | 0.0
| | SN(E/C) 1.42
|
| 
| 
| 
| 
| 
|