| Red | Green | Blue | |
| z | 17.64 | ||
| znorm | Inf | ||
| sky | -Inf | -Inf | -Inf |
| S/N | 28.6 | 48.2 | 50.7 |
| S/N(c) | 0.0 | 0.0 | 0.0 |
| SN(E/C) |
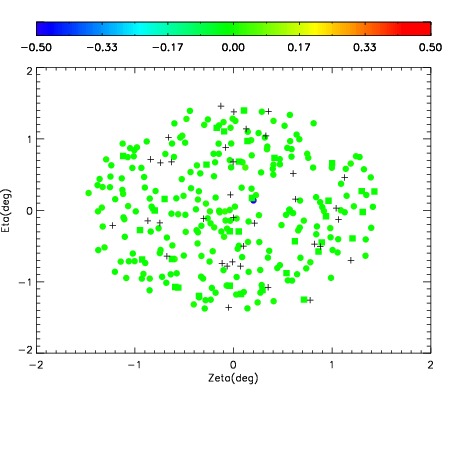
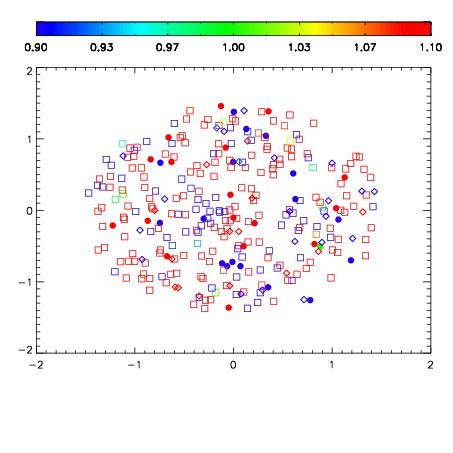
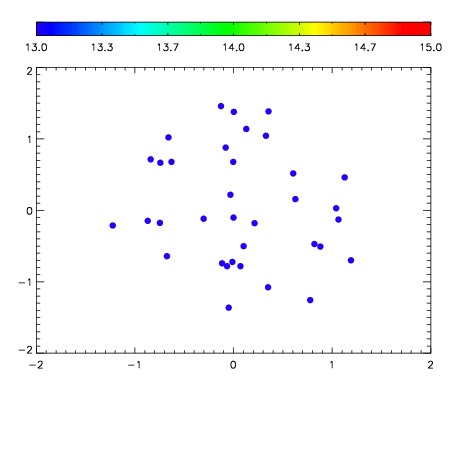

| Frame | Nreads | Zeropoints | Mag plots | Spatial mag deviation | Spatial sky 16325A emission deviations (filled: sky, open: star) | Spatial sky continuum emission | Spatial sky telluric CO2 absorption deviations (filled: H < 10) | |||||||||||||||||||||||
| 0 | 0 |
|
|
|
|
|
|
| IPAIR | NAME | SHIFT | NEWSHIFT | S/N | NAME | SHIFT | NEWSHIFT | S/N |
| 0 | 10210063 | 0.489945 | 0.00000 | 19.0571 | 10210068 | -0.00133923 | 0.491284 | 19.0443 |
| 1 | 10210067 | 0.487309 | 0.00263599 | 19.0375 | 10210065 | -0.00204886 | 0.491994 | 19.0219 |
| 2 | 10210062 | 0.489803 | 0.000142008 | 19.0250 | 10210064 | -0.00203219 | 0.491977 | 19.0050 |
| 3 | 10210066 | 0.486665 | 0.00327998 | 19.0046 | 10210061 | 0.00000 | 0.489945 | 18.9875 |