| Red | Green | Blue | |
| z | 17.64 | ||
| znorm | Inf | ||
| sky | -Inf | -Inf | -Inf |
| S/N | 26.6 | 45.3 | 47.8 |
| S/N(c) | 0.0 | 0.0 | 0.0 |
| SN(E/C) |
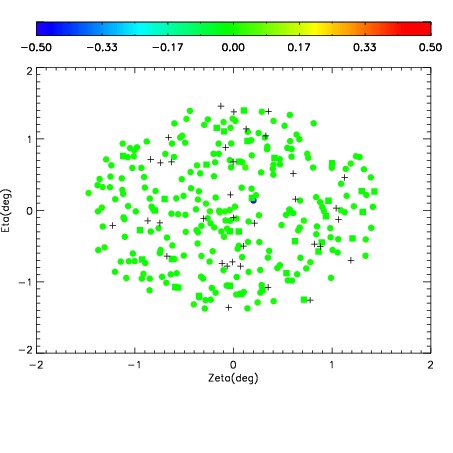
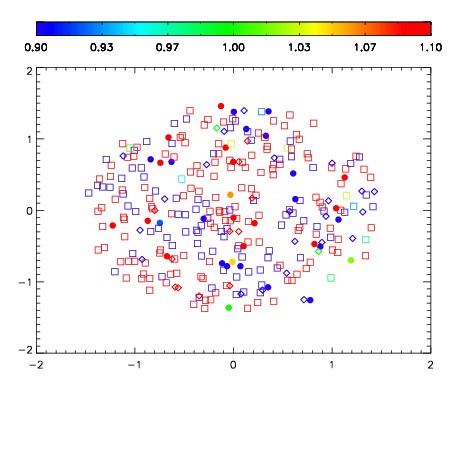


| Frame | Nreads | Zeropoints | Mag plots | Spatial mag deviation | Spatial sky 16325A emission deviations (filled: sky, open: star) | Spatial sky continuum emission | Spatial sky telluric CO2 absorption deviations (filled: H < 10) | |||||||||||||||||||||||
| 0 | 0 |
|
|
|
|
|
|
| IPAIR | NAME | SHIFT | NEWSHIFT | S/N | NAME | SHIFT | NEWSHIFT | S/N |
| 0 | 10250061 | 0.492338 | 0.00000 | 18.8487 | 10250063 | 0.000134823 | 0.492203 | 18.9580 |
| 1 | 10250065 | 0.491322 | 0.00101599 | 19.0132 | 10250066 | -0.000946872 | 0.493285 | 19.0088 |
| 2 | 10250064 | 0.491477 | 0.000860989 | 18.9901 | 10250062 | 0.000479000 | 0.491859 | 18.9601 |
| 3 | 10250060 | 0.492283 | 5.50151e-05 | 18.7998 | 10250059 | 0.00000 | 0.492338 | 18.8191 |