| Red | Green | Blue | |
| z | 17.64 | ||
| znorm | Inf | ||
| sky | -Inf | -Inf | -Inf |
| S/N | 24.1 | 44.4 | 46.3 |
| S/N(c) | 0.0 | 0.0 | 0.0 |
| SN(E/C) |


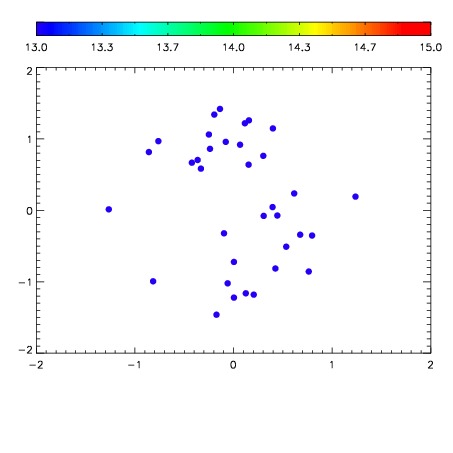

| Frame | Nreads | Zeropoints | Mag plots | Spatial mag deviation | Spatial sky 16325A emission deviations (filled: sky, open: star) | Spatial sky continuum emission | Spatial sky telluric CO2 absorption deviations (filled: H < 10) | |||||||||||||||||||||||
| 0 | 0 |
|
|
|
|
|
|
| IPAIR | NAME | SHIFT | NEWSHIFT | S/N | NAME | SHIFT | NEWSHIFT | S/N |
| 0 | 09990055 | 1.00940 | 0.00000 | 18.7812 | 09990049 | 0.525565 | 0.483835 | 18.8093 |
| 1 | 09990050 | 0.525014 | 0.484386 | 18.9010 | 09990051 | -0.000289438 | 1.00969 | 18.8115 |
| 2 | 09990056 | 0.528807 | 0.480593 | 18.8090 | 09990048 | 0.00000 | 1.00940 | 18.6992 |
| 3 | 09990053 | 0.523360 | 0.486040 | 18.6515 | 09990052 | -0.000320805 | 1.00972 | 18.6875 |