| Red | Green | Blue | |
| z | 17.64 | ||
| znorm | Inf | ||
| sky | -Inf | -NaN | -Inf |
| S/N | 30.6 | 52.4 | 54.9 |
| S/N(c) | 0.0 | 0.0 | 0.0 |
| SN(E/C) |
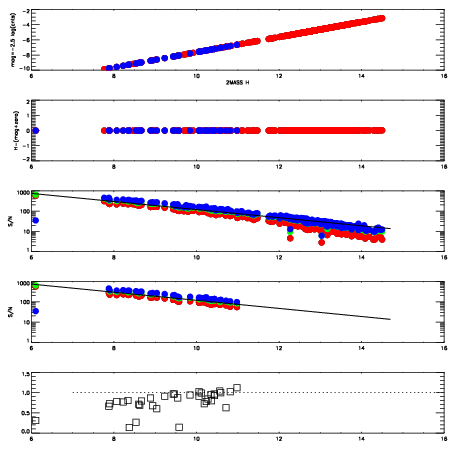
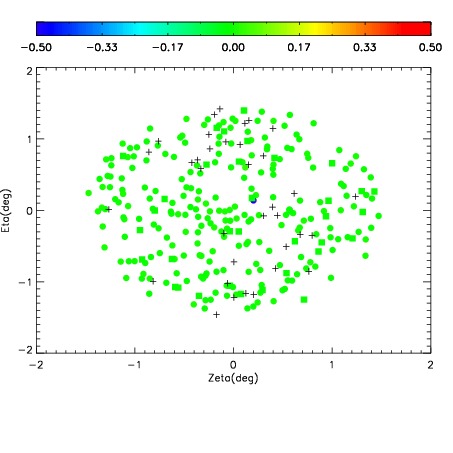

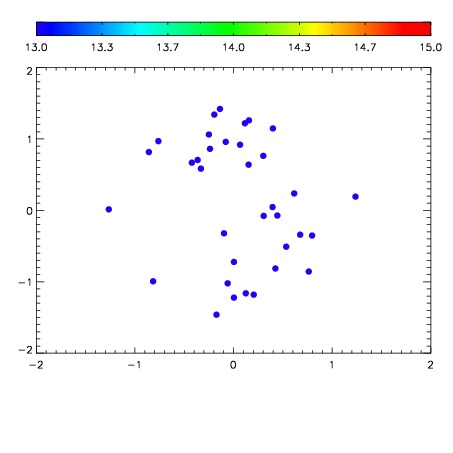

| Frame | Nreads | Zeropoints | Mag plots | Spatial mag deviation | Spatial sky 16325A emission deviations (filled: sky, open: star) | Spatial sky continuum emission | Spatial sky telluric CO2 absorption deviations (filled: H < 10) | |||||||||||||||||||||||
| 0 | 0 |
|
|
|
|
|
|
| IPAIR | NAME | SHIFT | NEWSHIFT | S/N | NAME | SHIFT | NEWSHIFT | S/N |
| 0 | 10220063 | 0.497874 | 0.00000 | 19.0891 | 10220068 | 0.00126695 | 0.496607 | 19.1397 |
| 1 | 10220066 | 0.494548 | 0.00332600 | 19.1166 | 10220065 | 0.00139846 | 0.496476 | 19.1447 |
| 2 | 10220067 | 0.493887 | 0.00398698 | 19.0686 | 10220061 | 0.00000 | 0.497874 | 19.1113 |
| 3 | 10220062 | 0.496628 | 0.00124601 | 19.0260 | 10220064 | 0.00104502 | 0.496829 | 19.1041 |