| Red | Green | Blue | |
| z | 17.64 | ||
| znorm | Inf | ||
| sky | -Inf | -Inf | -Inf |
| S/N | 26.4 | 47.2 | 49.2 |
| S/N(c) | 0.0 | 0.0 | 0.0 |
| SN(E/C) |
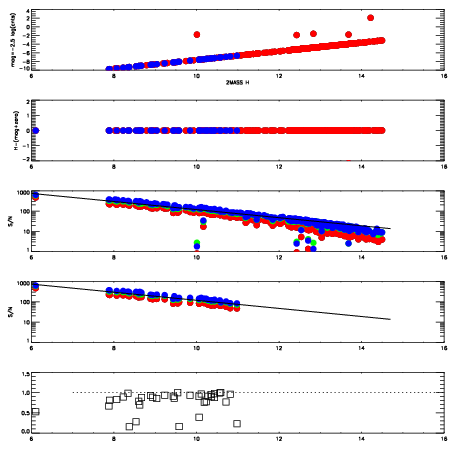
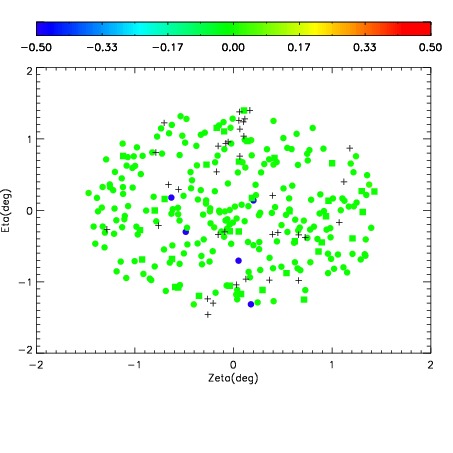


| Frame | Nreads | Zeropoints | Mag plots | Spatial mag deviation | Spatial sky 16325A emission deviations (filled: sky, open: star) | Spatial sky continuum emission | Spatial sky telluric CO2 absorption deviations (filled: H < 10) | |||||||||||||||||||||||
| 0 | 0 |
|
|
|
|
|
|
| IPAIR | NAME | SHIFT | NEWSHIFT | S/N | NAME | SHIFT | NEWSHIFT | S/N |
| 0 | 10460064 | 0.508358 | 0.00000 | 18.8310 | 10460063 | 0.00151099 | 0.506847 | 18.7922 |
| 1 | 10460061 | 0.504493 | 0.00386500 | 18.9896 | 10460062 | 0.000456085 | 0.507902 | 18.9570 |
| 2 | 10460060 | 0.503709 | 0.00464898 | 18.9609 | 10460059 | 0.00000 | 0.508358 | 18.8684 |
| 3 | 10460065 | 0.507898 | 0.000460029 | 18.7354 | 10460066 | 0.00464516 | 0.503713 | 18.6682 |