| Red | Green | Blue | |
| z | 17.64 | ||
| znorm | Inf | ||
| sky | -Inf | -Inf | -Inf |
| S/N | 23.7 | 41.8 | 43.7 |
| S/N(c) | 0.0 | 0.0 | 0.0 |
| SN(E/C) |
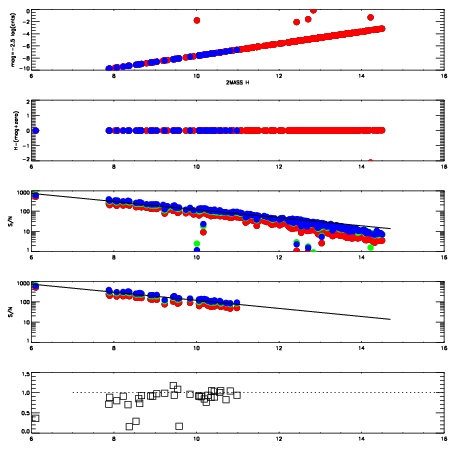
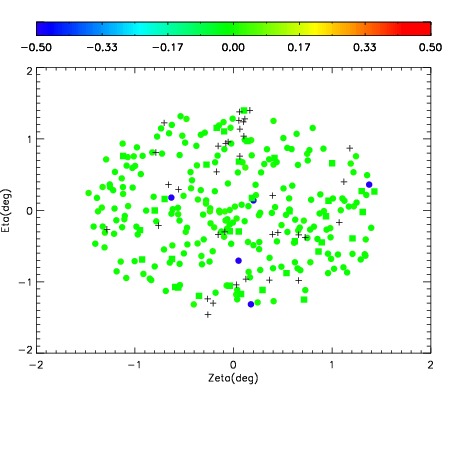

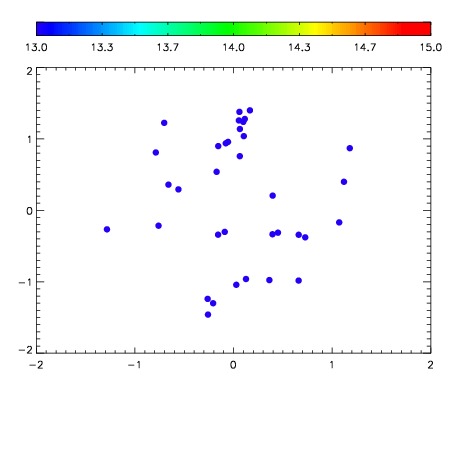

| Frame | Nreads | Zeropoints | Mag plots | Spatial mag deviation | Spatial sky 16325A emission deviations (filled: sky, open: star) | Spatial sky continuum emission | Spatial sky telluric CO2 absorption deviations (filled: H < 10) | |||||||||||||||||||||||
| 0 | 0 |
|
|
|
|
|
|
| IPAIR | NAME | SHIFT | NEWSHIFT | S/N | NAME | SHIFT | NEWSHIFT | S/N |
| 0 | 10800043 | 0.490923 | 0.00000 | 18.6278 | 10800041 | -0.00172323 | 0.492646 | 18.5557 |
| 1 | 10800038 | 0.489574 | 0.00134900 | 18.8393 | 10800037 | 0.00000 | 0.490923 | 18.8902 |
| 2 | 10800039 | 0.489849 | 0.00107399 | 18.7239 | 10800040 | -0.00214661 | 0.493070 | 18.7381 |
| 3 | 10800042 | 0.490272 | 0.000651002 | 18.6481 | 10800044 | -0.00122291 | 0.492146 | 18.6520 |