| Red | Green | Blue | |
| z | 17.64 | ||
| znorm | Inf | ||
| sky | -Inf | -Inf | -Inf |
| S/N | 27.9 | 46.0 | 48.7 |
| S/N(c) | 0.0 | 0.0 | 0.0 |
| SN(E/C) |
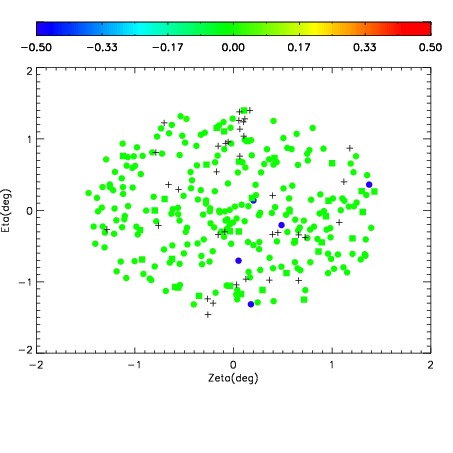
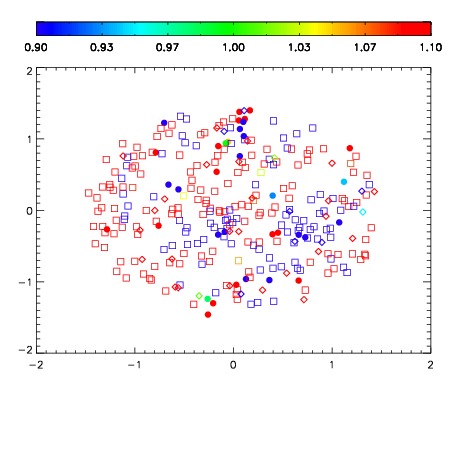
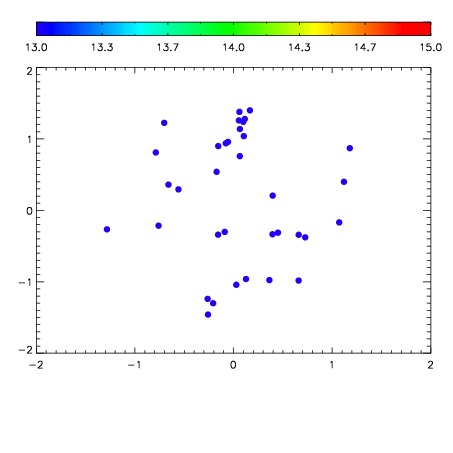

| Frame | Nreads | Zeropoints | Mag plots | Spatial mag deviation | Spatial sky 16325A emission deviations (filled: sky, open: star) | Spatial sky continuum emission | Spatial sky telluric CO2 absorption deviations (filled: H < 10) | |||||||||||||||||||||||
| 0 | 0 |
|
|
|
|
|
|
| IPAIR | NAME | SHIFT | NEWSHIFT | S/N | NAME | SHIFT | NEWSHIFT | S/N |
| 0 | 11140020 | 0.483823 | 0.00000 | 18.6780 | 11140019 | 0.00132209 | 0.482501 | 18.6091 |
| 1 | 11140013 | 0.483460 | 0.000362992 | 18.9327 | 11140011 | 0.00000 | 0.483823 | 18.8608 |
| 2 | 11140017 | 0.483775 | 4.80115e-05 | 18.8796 | 11140014 | -0.000815871 | 0.484639 | 18.8156 |
| 3 | 11140012 | 0.483129 | 0.000694007 | 18.8698 | 11140015 | -0.000776125 | 0.484599 | 18.8119 |
| 4 | 11140016 | 0.482616 | 0.00120699 | 18.8134 | 11140018 | 0.000700666 | 0.483122 | 18.7548 |