| Red | Green | Blue | |
| z | 17.64 | ||
| znorm | Inf | ||
| sky | -Inf | -Inf | -Inf |
| S/N | 24.5 | 41.5 | 44.9 |
| S/N(c) | 0.0 | 0.0 | 0.0 |
| SN(E/C) |
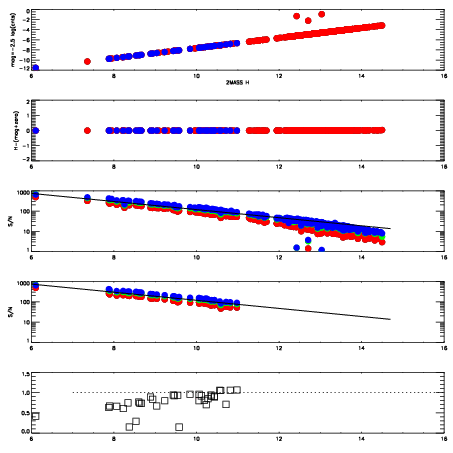


| Frame | Nreads | Zeropoints | Mag plots | Spatial mag deviation | Spatial sky 16325A emission deviations (filled: sky, open: star) | Spatial sky continuum emission | Spatial sky telluric CO2 absorption deviations (filled: H < 10) | |||||||||||||||||||||||
| 0 | 0 |
|
|
|
|
|
|
| IPAIR | NAME | SHIFT | NEWSHIFT | S/N | NAME | SHIFT | NEWSHIFT | S/N |
| 0 | 10820041 | 0.485621 | 0.00000 | 19.1132 | 10820042 | -0.000942751 | 0.486564 | 19.0171 |
| 1 | 10820040 | 0.485110 | 0.000510991 | 18.8999 | 10820039 | -0.000613718 | 0.486235 | 18.9185 |
| 2 | 10820037 | 0.485209 | 0.000412017 | 18.7332 | 10820038 | -0.000985984 | 0.486607 | 18.8953 |
| 3 | 10820036 | 0.485466 | 0.000155002 | 18.6939 | 10820035 | 0.00000 | 0.485621 | 18.8877 |