| Red | Green | Blue | |
| z | 17.64 | ||
| znorm | Inf | ||
| sky | -NaN | -NaN | -Inf |
| S/N | 30.4 | 50.7 | 54.5 |
| S/N(c) | 0.0 | 0.0 | 0.0 |
| SN(E/C) |
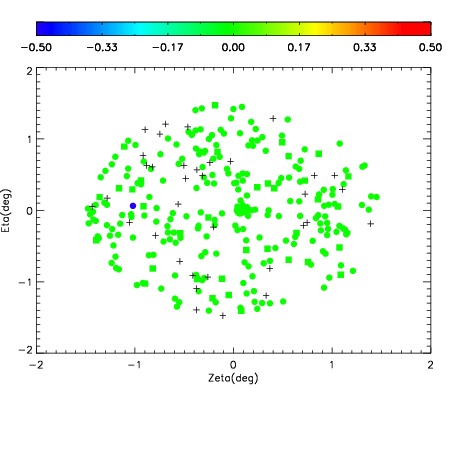
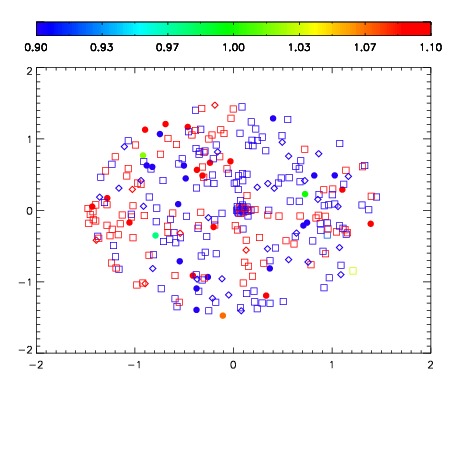
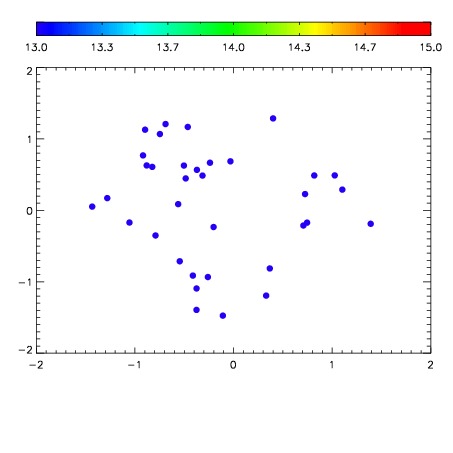

| Frame | Nreads | Zeropoints | Mag plots | Spatial mag deviation | Spatial sky 16325A emission deviations (filled: sky, open: star) | Spatial sky continuum emission | Spatial sky telluric CO2 absorption deviations (filled: H < 10) | |||||||||||||||||||||||
| 0 | 0 |
|
|
|
|
|
|
| IPAIR | NAME | SHIFT | NEWSHIFT | S/N | NAME | SHIFT | NEWSHIFT | S/N |
| 0 | 06310013 | 0.477827 | 0.00000 | 19.1792 | 06310011 | 0.00000 | 0.477827 | 19.1578 |
| 1 | 06310017 | 0.477723 | 0.000104010 | 19.2427 | 06310018 | -0.000567987 | 0.478395 | 19.2505 |
| 2 | 06310016 | 0.476895 | 0.000932008 | 19.2083 | 06310014 | -0.000261397 | 0.478088 | 19.2101 |
| 3 | 06310012 | 0.476786 | 0.00104102 | 19.1900 | 06310015 | -0.00348819 | 0.481315 | 19.1638 |