| Red | Green | Blue | |
| z | 17.64 | ||
| znorm | Inf | ||
| sky | -Inf | -Inf | -Inf |
| S/N | 8.2 | 15.2 | 16.6 |
| S/N(c) | 0.0 | 0.0 | 0.0 |
| SN(E/C) |

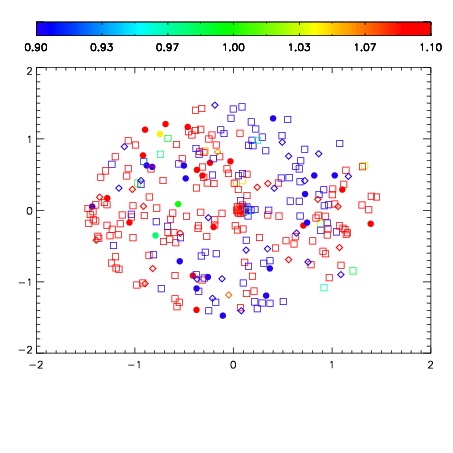
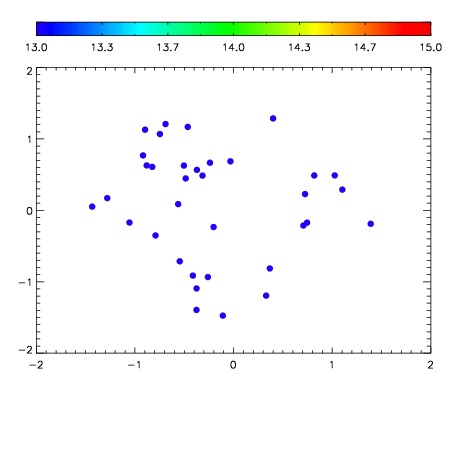

| Frame | Nreads | Zeropoints | Mag plots | Spatial mag deviation | Spatial sky 16325A emission deviations (filled: sky, open: star) | Spatial sky continuum emission | Spatial sky telluric CO2 absorption deviations (filled: H < 10) | |||||||||||||||||||||||
| 0 | 0 |
|
|
|
|
|
|
| IPAIR | NAME | SHIFT | NEWSHIFT | S/N | NAME | SHIFT | NEWSHIFT | S/N |
| 0 | 06620016 | 0.486798 | 0.00000 | 16.1914 | 06620017 | 0.00531249 | 0.481485 | 16.5728 |
| 1 | 06620011 | 0.483887 | 0.00291100 | 17.9030 | 06620010 | 0.00000 | 0.486798 | 18.0145 |
| 2 | 06620012 | 0.484161 | 0.00263700 | 17.7741 | 06620013 | 0.00664632 | 0.480152 | 17.8254 |
| 3 | 06620015 | 0.486386 | 0.000411987 | 17.2748 | 06620014 | 0.00316934 | 0.483629 | 16.6075 |