| Red | Green | Blue | |
| z | 17.64 | ||
| znorm | Inf | ||
| sky | -Inf | -NaN | -Inf |
| S/N | 25.2 | 43.4 | 46.6 |
| S/N(c) | 0.0 | 0.0 | 0.0 |
| SN(E/C) |
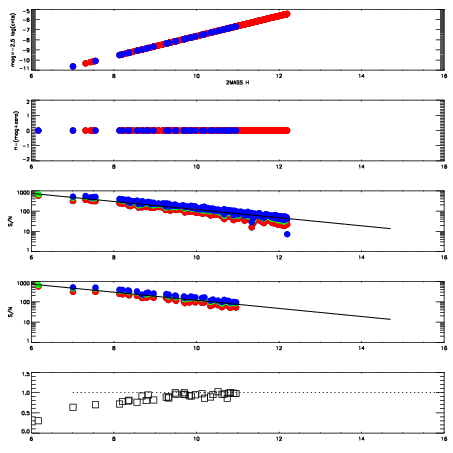
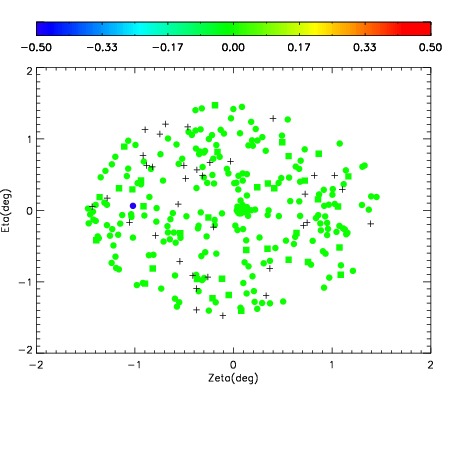
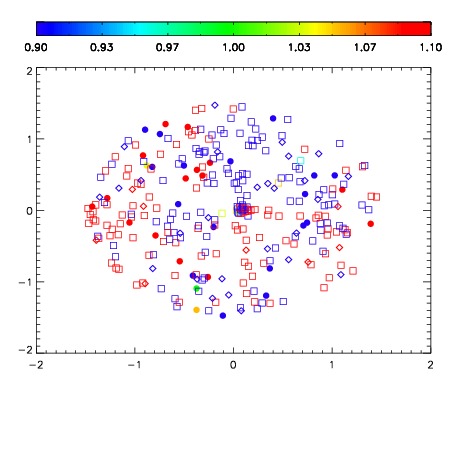
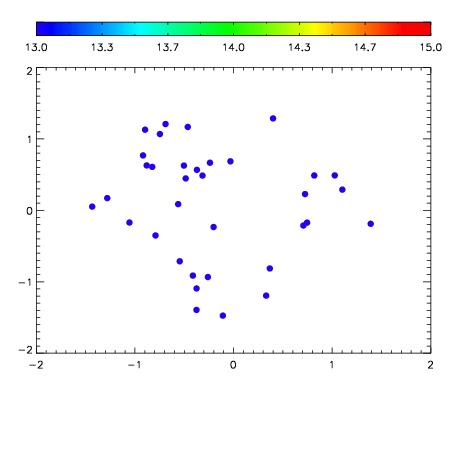

| Frame | Nreads | Zeropoints | Mag plots | Spatial mag deviation | Spatial sky 16325A emission deviations (filled: sky, open: star) | Spatial sky continuum emission | Spatial sky telluric CO2 absorption deviations (filled: H < 10) | |||||||||||||||||||||||
| 0 | 0 |
|
|
|
|
|
|
| IPAIR | NAME | SHIFT | NEWSHIFT | S/N | NAME | SHIFT | NEWSHIFT | S/N |
| 0 | 06660016 | 0.487879 | 0.00000 | 18.9504 | 06660017 | 0.000333565 | 0.487545 | 18.9777 |
| 1 | 06660011 | 0.484270 | 0.00360900 | 19.0317 | 06660014 | -0.000218356 | 0.488097 | 19.0517 |
| 2 | 06660012 | 0.484214 | 0.00366500 | 18.9904 | 06660013 | 0.00273231 | 0.485147 | 19.0055 |
| 3 | 06660015 | 0.487027 | 0.000852019 | 18.9349 | 06660010 | 0.00000 | 0.487879 | 18.9509 |